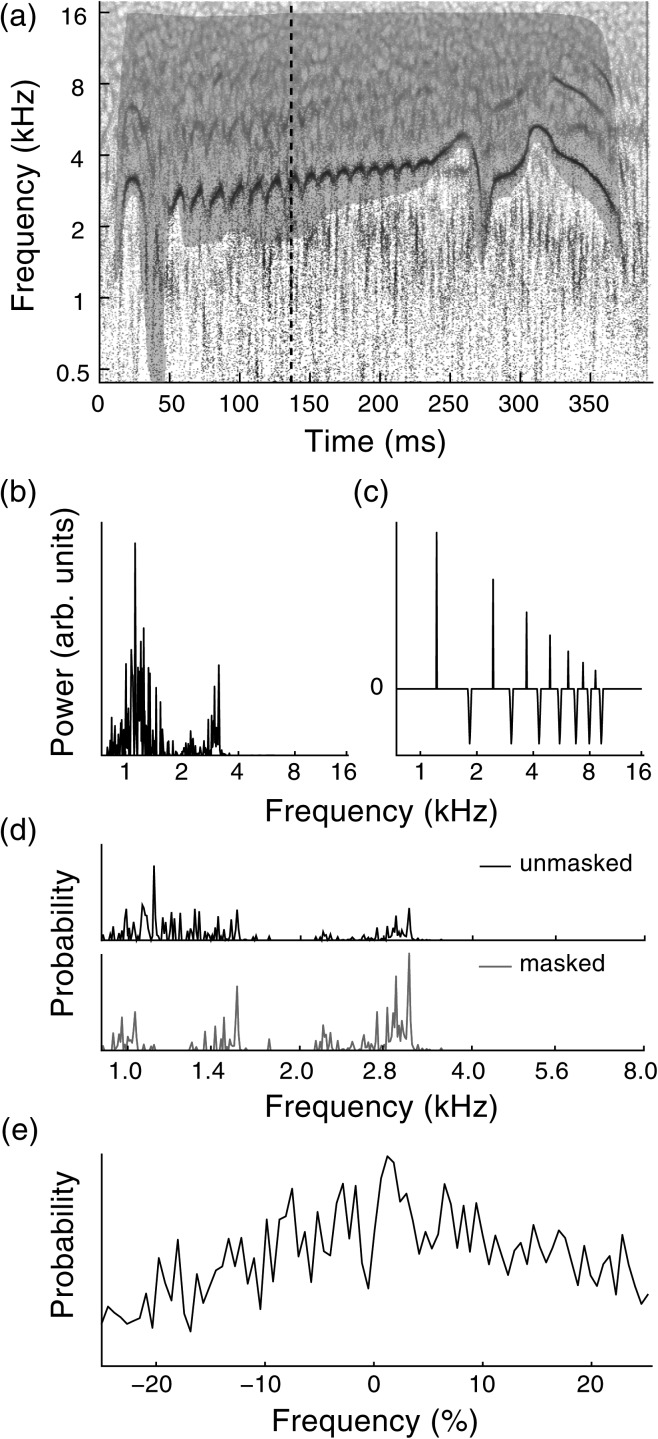
Figure 2.
(Color online) Example of F0 tracking analysis. (a) Time-frequency reassignment spectrogram of a superb starling flight call motif. Shaded region is a manually drawn mask used to reduce influence of low-frequency noise. Dashed line indicates time frame analyzed in subsequent panels. (b) Power spectrum in example time frame. Note the peak corresponding to the fundamental frequency of the vocalization, around 3 kHz, is small relative to the low-frequency noise. (c) Harmonic template, with logarithmically spaced peaks to detect harmonic structure. (d) Cross correlations of spectrum with harmonic template. Masking the spectrogram [shaded polygon in (a)] reduces low-frequency interference so that the highest peak corresponds to the fundamental frequency. (e) Cross correlation between the example frame and the following time point, which is used by the particle filter to smooth estimates. The peak at +2% indicates F0 is increasing.

