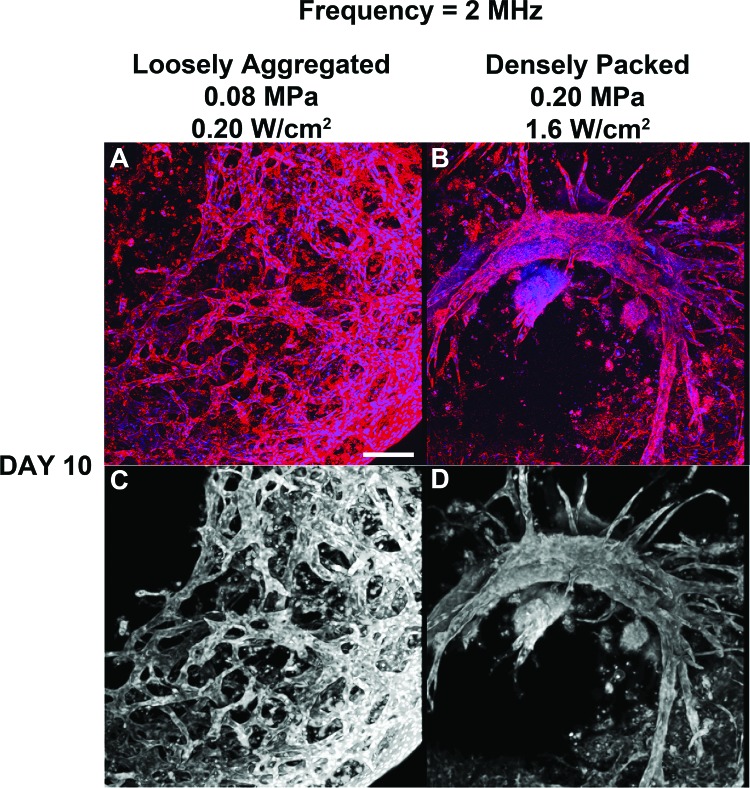
Figure 6.
Analysis of endothelial network morphology formed in response to 2-MHz ultrasound. Unpolymerized solutions of type I collagen and endothelial cells were exposed to a 2-MHz CW ultrasound standing wave field, as described in the legend to Fig. 5. Following a 10-day incubation, samples were processed for immunofluorescence microscopy. CD31 was visualized by staining with a mouse anti-human CD31 monoclonal antibody (red). Cell nuclei were visualized by co-staining with DAPI (blue). Multiphoton microscopy was used to collect top view images along the z axis in 1 μm slices. Images were then projected onto the z-plane using ImageJ (NIH). Representative z-stack images are shown before [(A) and (B)] and after [(C) and (D)] image processing (n = 3). Scale bar, 50 μm.

