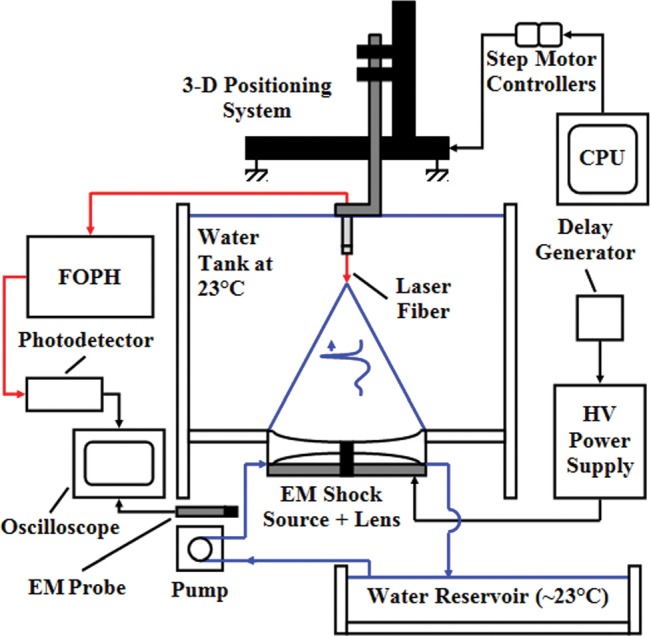
Figure 1.

(Color online) Diagram of the experimental setup with the tank, actuator, and lens in the center. Arrows show the FOPH setup and the flow of water to the space behind the lens. Also shown is the 3D positioning system used to position the FOPH for pressure measurement.
