
Figure 10.
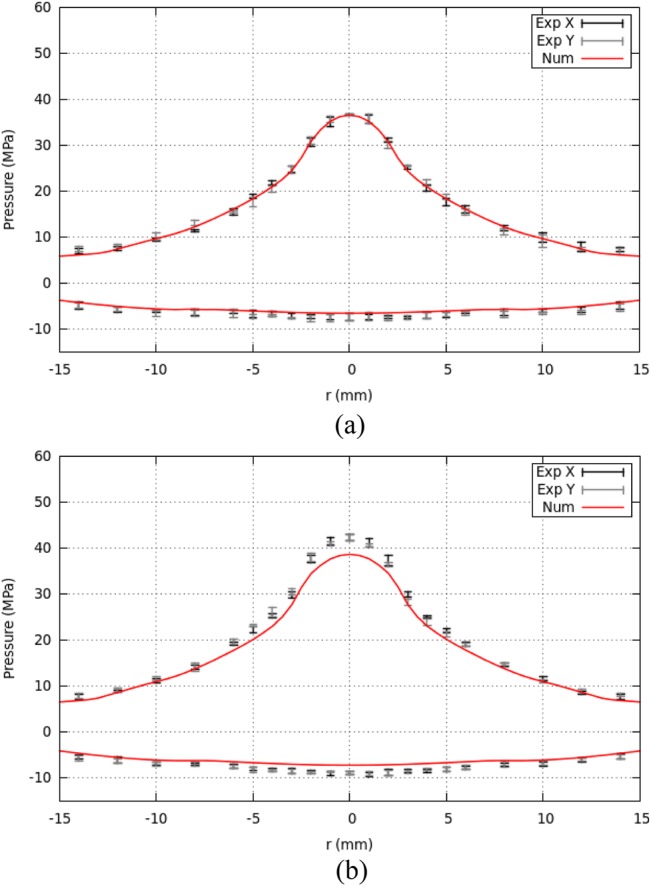
(Color online) Plots of peak positive and peak negative pressure in the focal plane ( mm) for the new lens. Experimental data is recorded in four directions from the z-axis . Numerical data is mirrored across to aid in visualization. (a) 15.8 kV. (b) 16.8 kV.