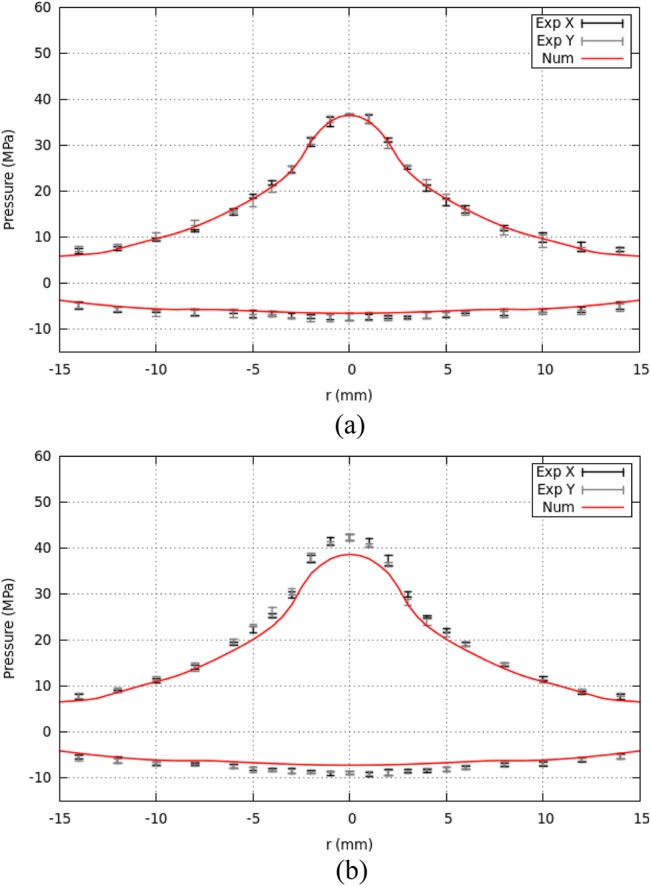
Figure 11.

(Color online) Comparison of peak positive pressure , peak negative pressure , and beam width for the new lens with available experimental data over the dynamic range of the lithotripter. Polynomial fits are also shown (dotted lines for numerical and solid lines for experiment).
