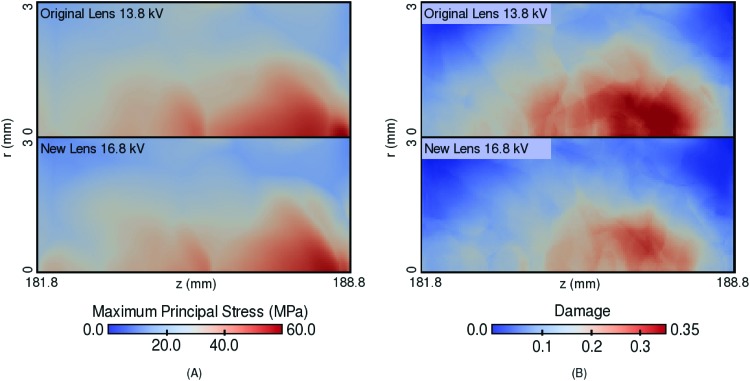
Figure 12.
Comparison of the maximum over time of the maximum principal stress (a) and the damage (b) in a cylindrical kidney stone simulant with height 7 mm and radius 3 mm for the original lens with 13.8 kV input versus the new lens with 16.8 kV input after the pulse has passed completely through.

