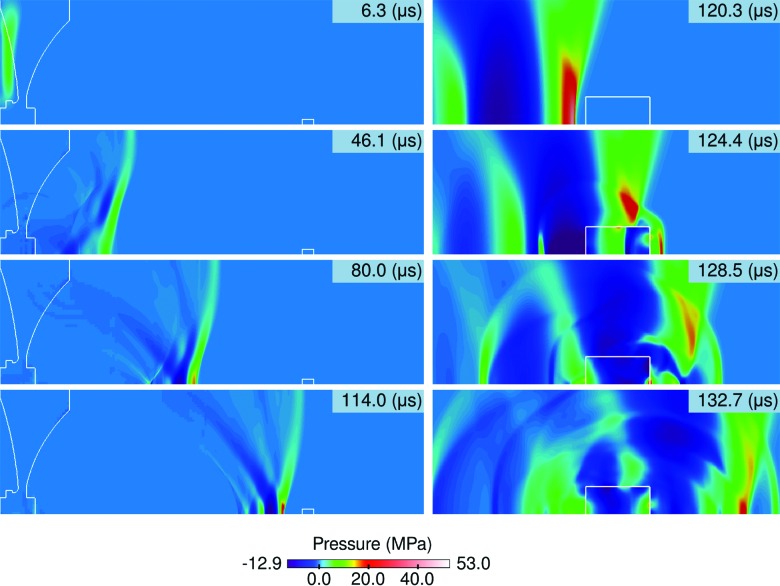
Figure 4.
Progression of the computational solution at selected times. On the left, the focusing and shock wave formation over the entire computational domain is shown. On the right, the interaction of the shock wave in the fluid region and elastic stone is shown. The original lens and 15.8 kV input is used here. Within the elastic regions, the average of the normal stresses is displayed as pressure.

