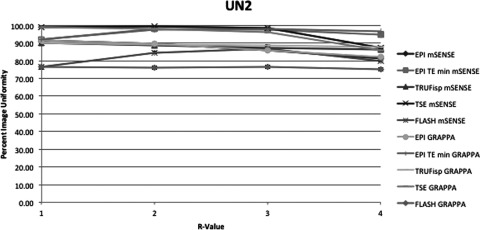
Figure 4.

This figure displays the UN2 uniformity measurement method of each pulse sequence and PPI method acquired. The x-axis indicates R-value. At R = 1 there was no parallel imaging implemented. The y-axis indicates PIU where 100 is a perfectly uniform image, i.e., all pixels have the same value.
