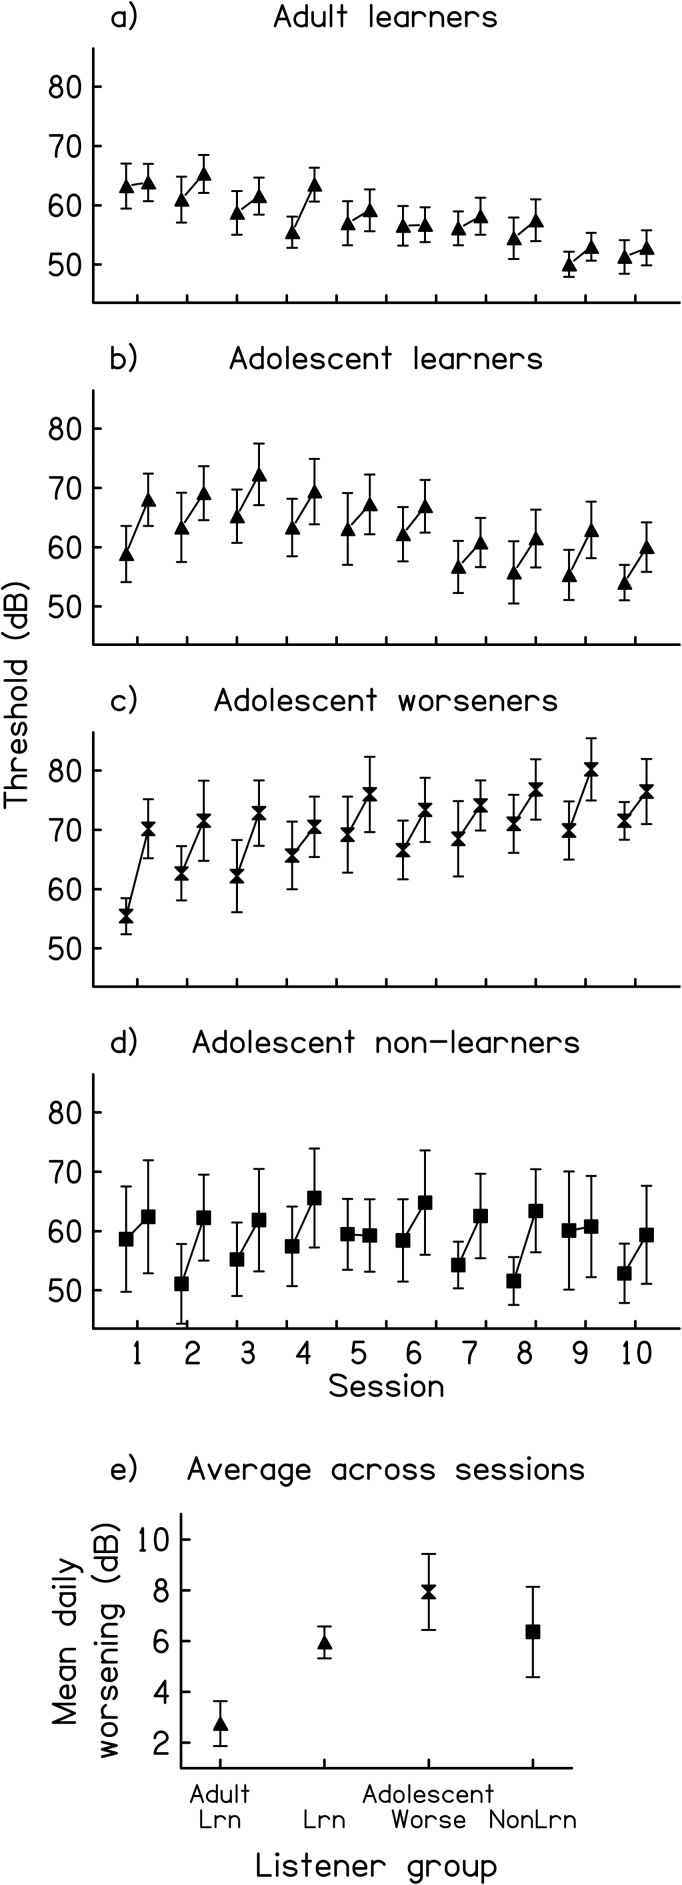
Figure 2.
Within-session performance on the trained backward-masking condition. (a)–(d) Mean threshold values from early (estimates 1–6) and late (estimates 19–24) during each training session. Results are shown separately for the (a) adult learners (n = 10) and each group of adolescents: (b) learners (n = 10), (c) worseners (n = 6), and (d) non-learners (n = 4). (e) Change in threshold (late minus early threshold estimates) averaged across the training sessions for each of the four trained groups. Error bars indicate +/− one standard error.

