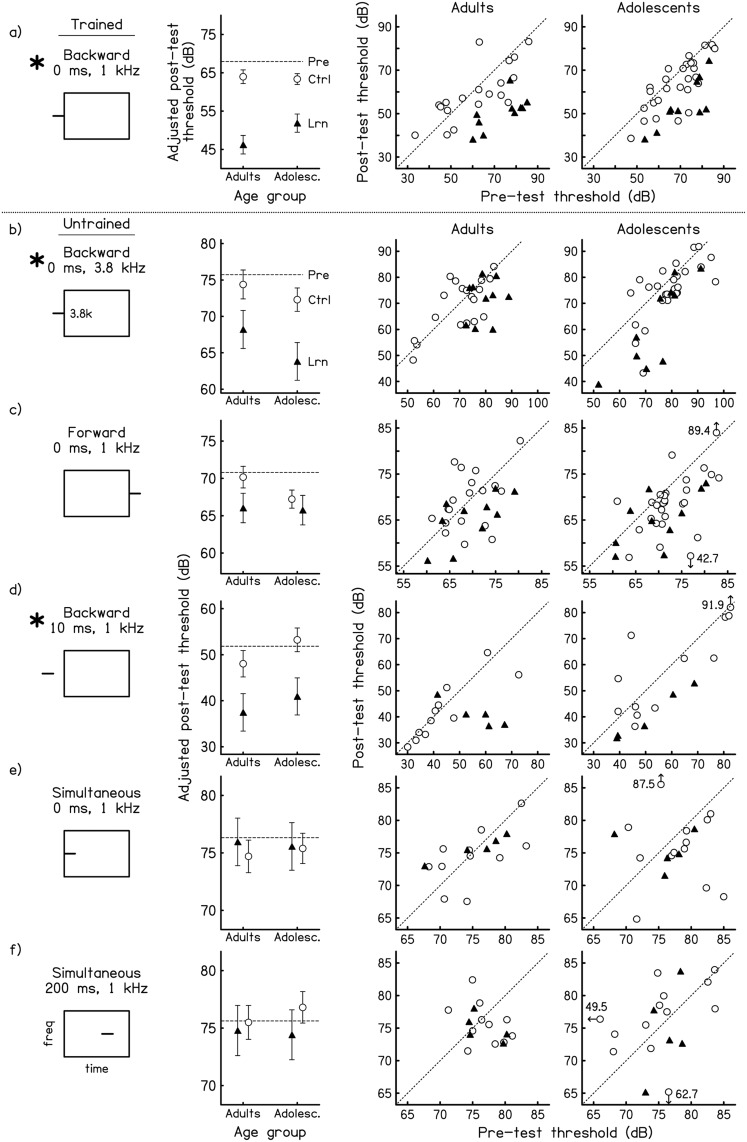
Figure 3.
Pre- and post-test performance of learners and controls on the trained and untrained conditions. Signal detection thresholds (dB for 94.2% correct) for adult and adolescent learners (filled triangles) and controls (open circles) on (a) the trained backward-masking condition and (b)–(f) the five untrained masking conditions. Note that due to the variability in thresholds across conditions, the range of the axes is different for each condition. Condition labels and schematics are shown in the 1st column. Asterisks mark the conditions on which the learners improved more than same-age controls. Mean data (2nd column): Post-test thresholds for each group after adjusting for pre-test thresholds using IBM-SPSS Statistics 20.3 Error bars indicate +/− one standard error and the dashed horizontal line indicates the average pre-test threshold across all four groups. Individual data (3rd and 4th columns): pre- and post-test thresholds for individual listeners. The dotted diagonal line in each panel has a slope of 1, indicating equivalent performance on the pre- and post-tests. Points below this line therefore represent individuals who improved while points above this line represent individuals who got worse.

