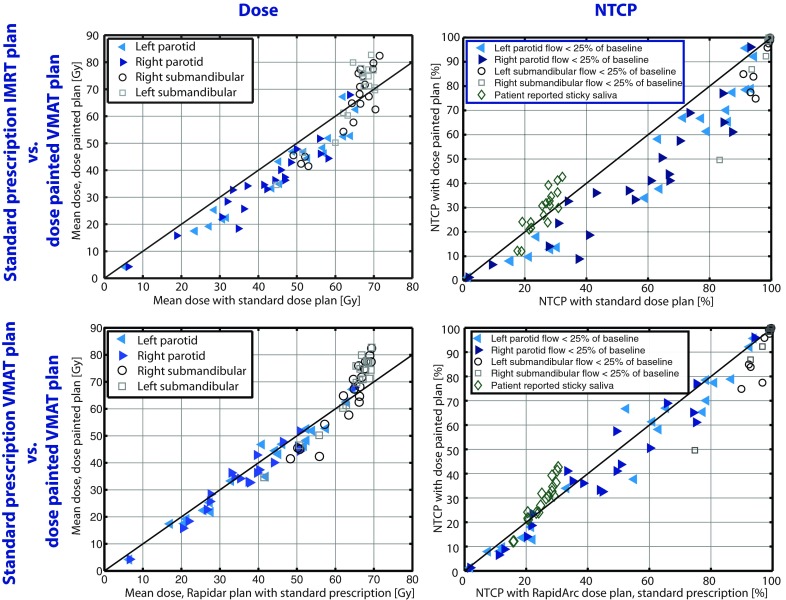
Figure 4.
(Left) Mean physical doses to the salivary gland structures with the dose painted plans versus the delivered plans (upper) or reoptimized VMAT plans with standard prescription (lower) in 20 patients. (Right) Normal tissue complication probability for the salivary gland structures (Refs. 15, 16, 17). The models presented on submandibular toxicity is for stimulated flow (Ref. 16) and in the multivariate model of sticky saliva we assumed, for illustration, a patient of age 60 and same dose to sublingual glands as for the submandibular glands (Ref. 17).

