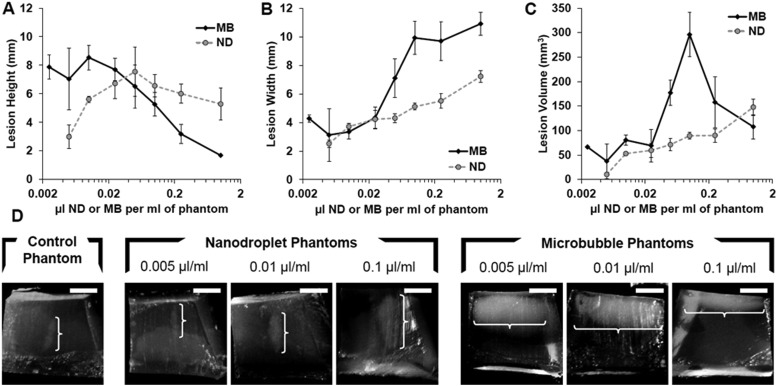
Figure 5.
(Color online) Ablation lesion height (A), width (B), and corresponding volume (C) as a function of ND or MB concentration in tissue-mimicking phantoms following HIFU exposure for 20 s at 4 MPa PNP. (D) Representative images of lesions formed inside the AAPs containing no agents, ND, or MB at various concentrations. The location and size of each lesion is indicated by the superimposed white bracket. The white scale bar in the upper right corner of each image represents 5 mm.

