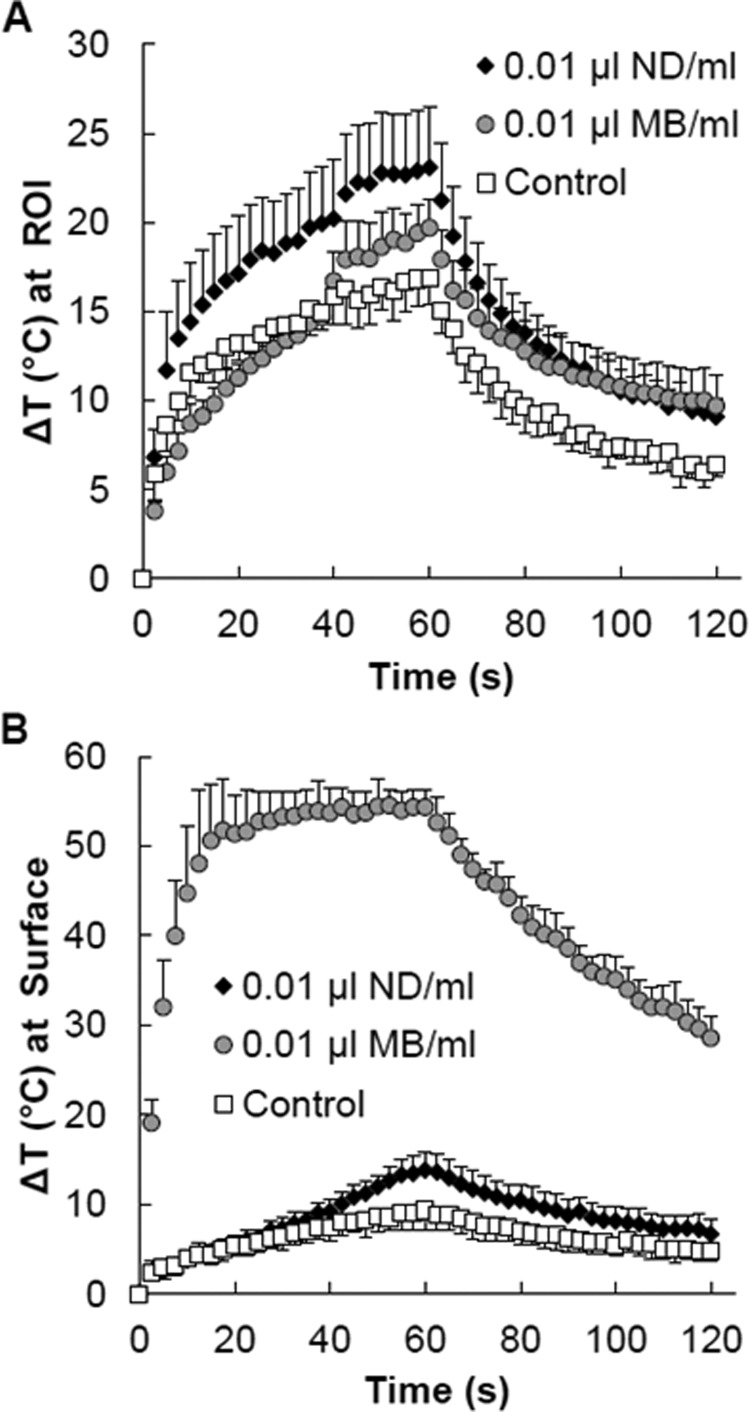
Figure 8.
For each MR acquisition over time, the maximum change in temperature (A) at the focus (ROI) and at the (B) surface of the phantom was extracted from the corresponding horizontal slices from those locations. Time curves were averaged, and data are presented as the means ± s.d. (n ≥ 3). Phantoms contained 0.01 μl of ND/MB per milliliter of phantom material or no agents (control).

