
Figure 22.
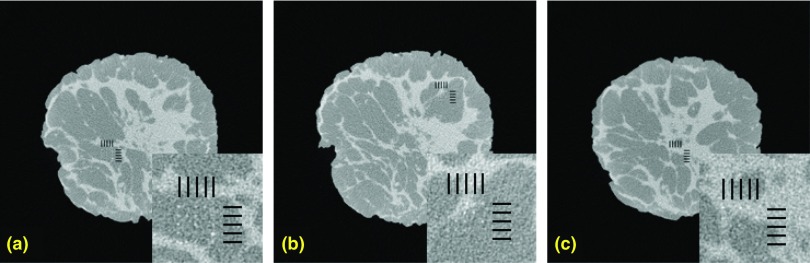
Comparison of test images with the magnified ROI shown on the bottom. Shown here are noisy test images used in the observer study. The possible locations of the microcalcifications were indicated by the hash marks. (A magnified ROI indicating the possible locations of the microcalcifications is displayed to the bottom right side of these images).