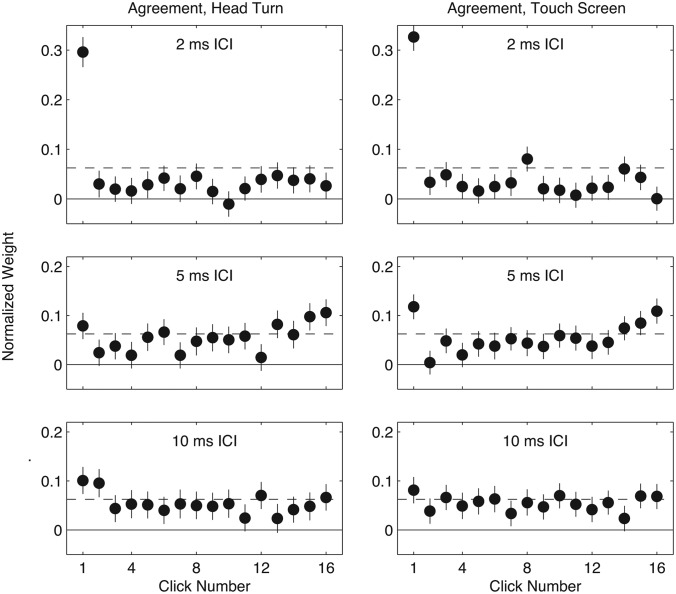
Figure 1.
Subject-averaged TWFs for ITD and ILD in agreement. Left: head-turn response, right: touchscreen response. In each panel, normalized weights (y-axis) are plotted for each click in a train, as a function of the temporal order of the clicks (x-axis). Symbols plot the mean of normalized weights across subjects; error bars indicate bootstrapped 95% confidence intervals on mean weights. The dashed horizontal line in each panel indicates the value that would obtain if all clicks were equally weighted (1/16), while the solid line indicates zero. Top to bottom, panels plot TWFs for 2, 5, and 10 ms ICI, respectively.

