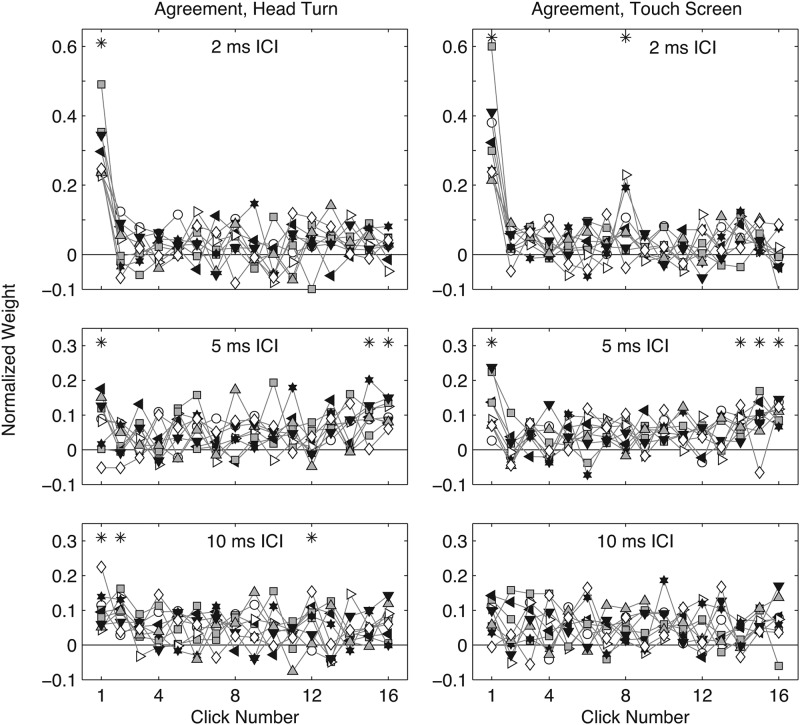
Figure 2.
Individual-subject TWFs for ITD and ILD in agreement. Left: head-turn response, right: touchscreen response. As in Fig. 1, panels plot normalized click weight (y-axis) as a function of the temporal order of clicks in a train (x-axis). Symbols indicate TWFs for individual subjects. Asterisks (*) mark clicks where a statistically significant proportion of subjects (p < 0.05) demonstrated significantly non-zero weights on an individual basis (also p < 0.05). Other conventions (dashed line at 1/16, solid line at 0, ICI = 2, 5, 10 ms from top to bottom panels, respectively) as in Fig. 1.

