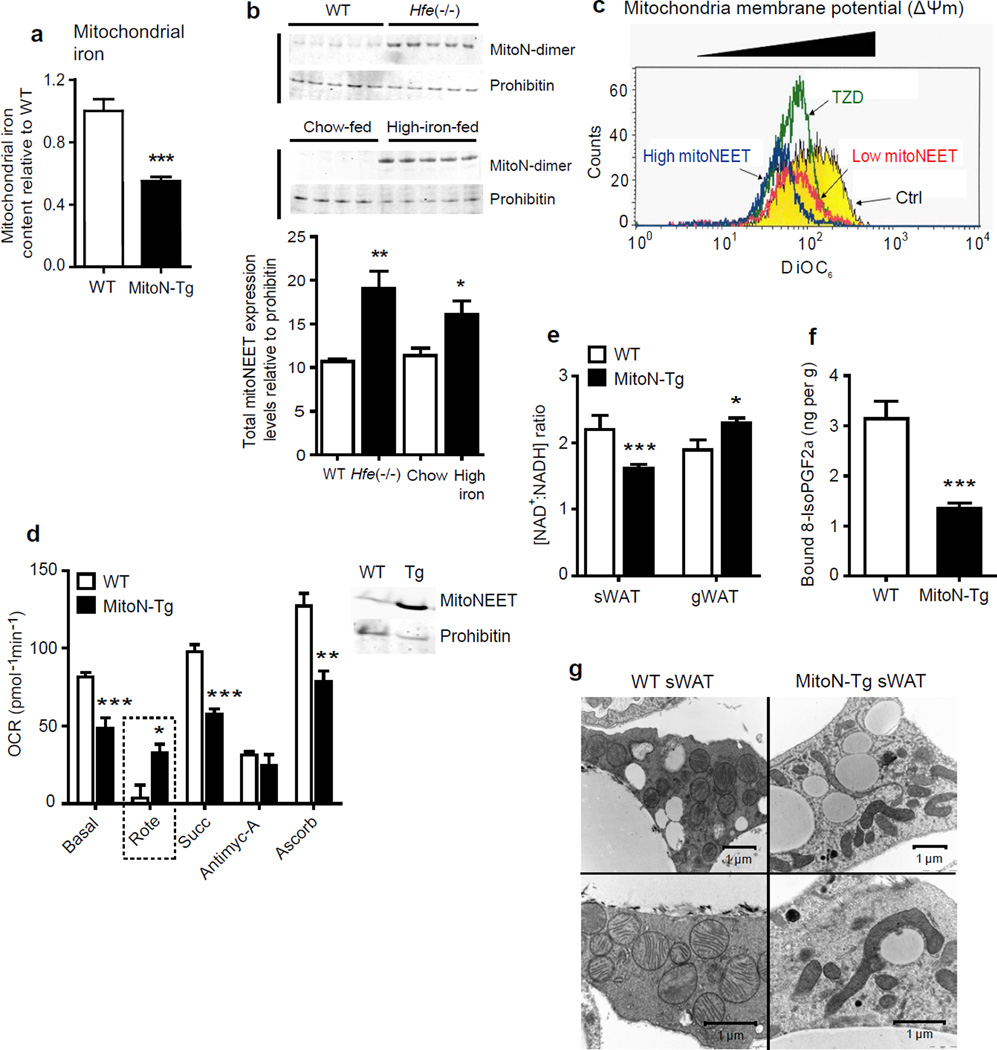
Figure 4.
MitoNEET compromises mitochondrial dynamics and morphology by modulating mitochondrial iron content. (a) Mitochondrial iron content in WT sWAT versus MitoN-Tg sWAT (n = 7 per group). ***P < 0.001. (b) Total mitoNEET expression levels (monomer and dimer) in WT mice versus Hfe−/− mice (top panel), in addition to chow-fed control mice versus high iron-diet-fed (n = 5 per group). (b) Mitochondrial membrane potential (ΔΨm) using DiOC6 incubated with control vehicle, or low- and high-mitoNEET expressing 3T3-L1 preadipocytes. Yellow-panel: control vehicle; green-panel: TZD-treated; red-panel: low mitoNEET expression; blue-panel: high mitoNEET expression. (d) Oxygen-consumption rates (OCRs) in mitochondria (1 µg) isolated from WT (blue-panel) and MitoN-Tg (red-panel) sWAT, in response to sequential additions of DMEM (containing FCCP and, the substrates pyruvate and malate), rotenone (complex I inhibitor), succinate (complex II substrate), antimycin-A (complex III inhibitor), ascorbate and TMPD (cytochrome c substrate) (n = 4 per group). Prohibitin was utilized as a mitochondrial protein loading control. (e) NAD+: NADH ratio in WT and MitoN-Tg sWAT and gWAT (n = 5 per group). (f) Lipid-induced (15 ul g−1 body-weight 20% intralipid; single gavage with tissues harvested following 6 h induction) ROS-promoted lipid damage (lipid-peroxidation, as measured by bound 8-isoPGF2α levels) in WT and MitoN-Tg sWAT (n = 5 per group). (g) Representative EM images (16,500× and 26,500× magnifications) of unchallenged WT and MitoN-Tg sWAT.

