Figure 1.

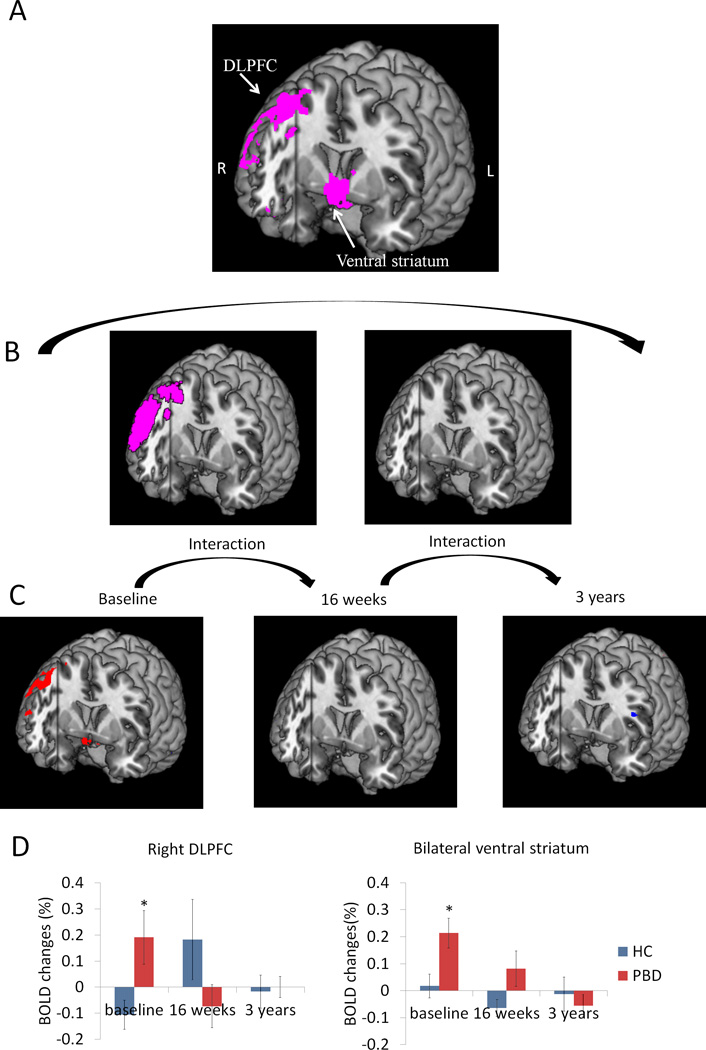
Group differences in activation during affective color matching paradigm were moderated by time. Panel A) PBD differed from HC in activation of right DLPFC and bilateral ventral striatum between baseline and 3-year follow up. B) Interactions between groups and time were also explored for baseline to 16 weeks (left) and for 16 weeks to three years (right). Significant group differences between baseline to 16 weeks were found, but not between 16 weeks to three years. C) Group difference at each time point is shown to inform interactions. In red are regions where PBD > HC. In blue are regions where HC > PBD. D) Blood-oxygenation level dependent (BOLD) signal changes are plotted for the right DLPFC and bilateral ventral striatum to elucidate the nature of group differences across time. The interaction between time and group was significant [F(4, 15) = 3.43, p = 0.04]. The PBD group showed higher levels of activation at baseline relative to HC [t(21) = 2.34, p = 0.03 for right DLPFC, t(21) = 2.65, p = 0.02 for bilateral ventral striatum], and over time, their activation normalized and became similar to that of the HC group.
