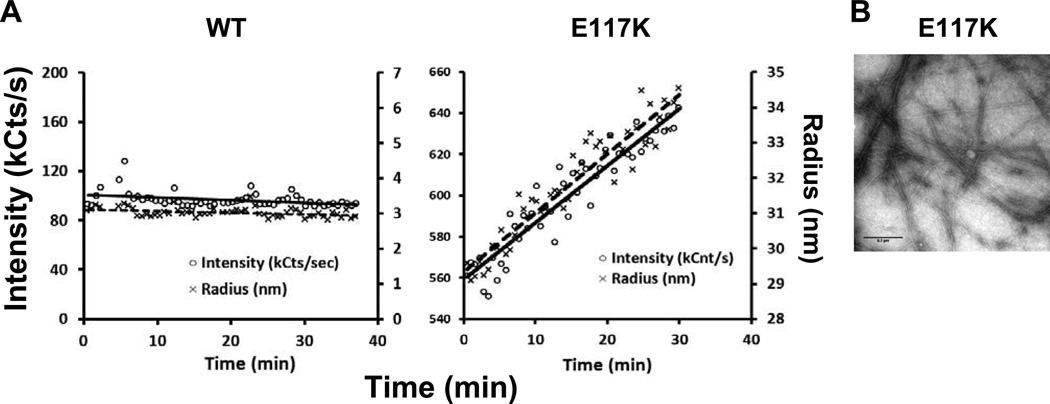
Figure 3.
Dynamic light scattering analyses of filtered WT and mutant G-actin samples. A: One micromolar G-actin samples were placed in a dynamic light scattering apparatus and the change in scattering was followed over time at room temperature as described in the methods. For each panel, the left vertical axis depicts the signal intensity, and the right vertical axis depicts the average radius of bodies in the sample. B: Short filaments were present in the 6.9 mM mutant G-actin sample in G-buffer after 1 hr. No filaments were present in the WT sample.

