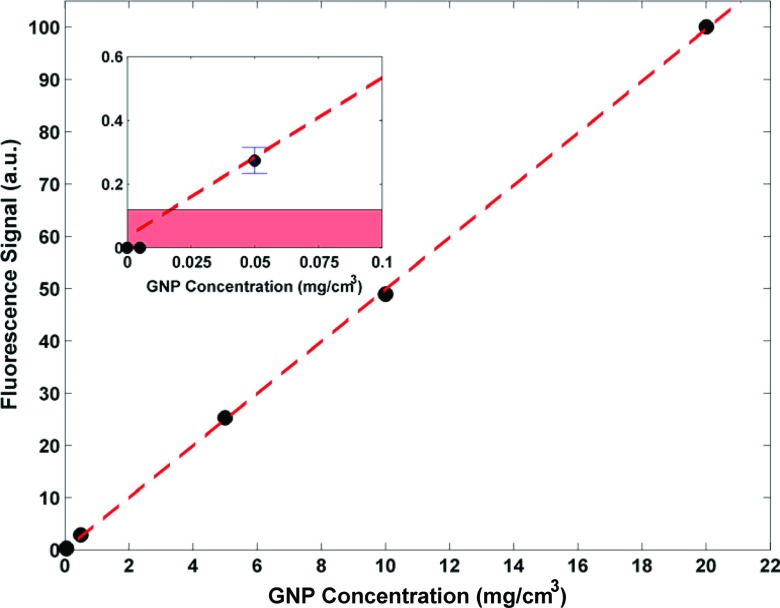
Figure 5.
Data acquired from calibration phantoms, showing a linear relationship between fluorescence signal (arbitrary units) and GNP concentration (mg/cm3). The corresponding GNP mass per 1.73 × 10⁻² cm3 voxel for each data point (20, 10, 5, 0.5, 0.05, 0.005, and 0 mg/cm3) is approximately 350, 175, 87.5, 8.75, 0.875, 0.0875, and 0 μg assuming uniform distribution of GNPs. Error bars for data points are much smaller than the size of the data symbols. (Inset) The intersection of the best-fit line and the border of the shaded region highlights the detection limit of the system (GNP concentration of ∼0.02 mg/cm3, corresponding to ∼0.35 μg of GNP within the 1.73 × 10⁻² cm3 voxel).

