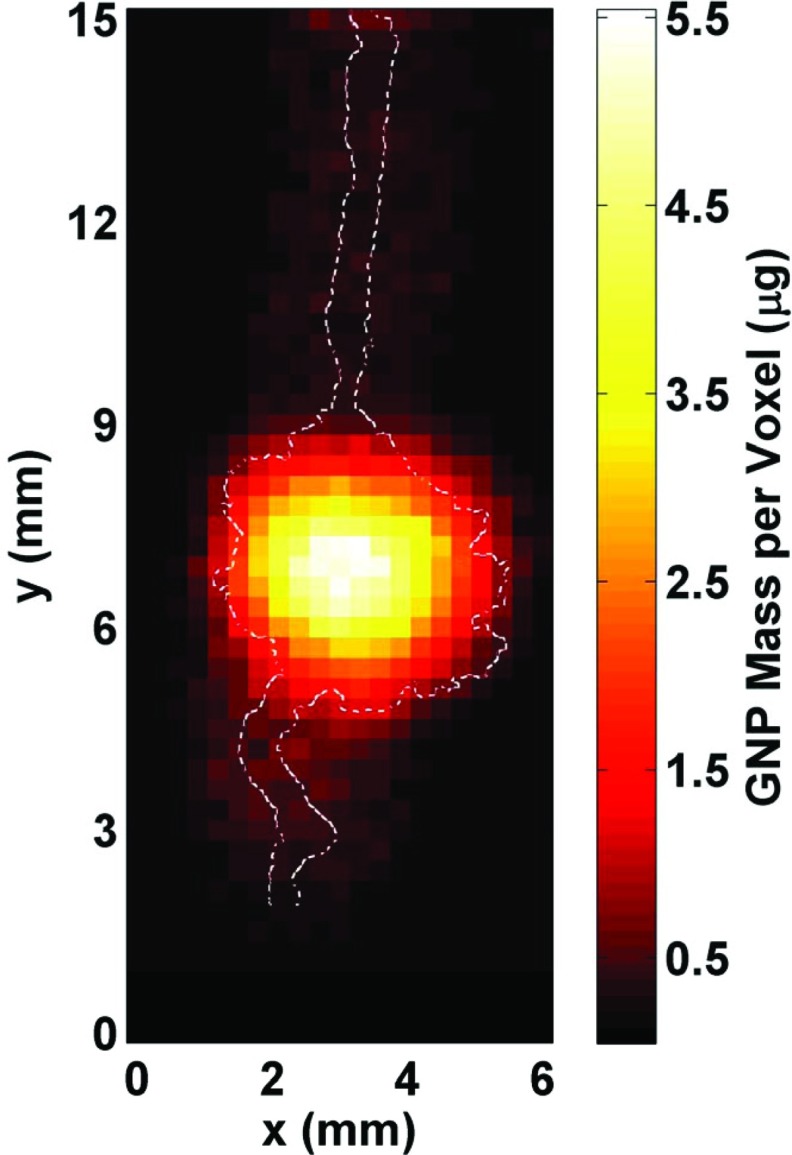
Figure 6.
2D fluorescence map of the region of interest (6 mm horizontal × 15 mm vertical) within the phantom generated from the processed data. The GNP distribution (in mass per 2.70 × 10⁻⁴ cm3 voxel) within the simulated tumor region and blood vessels is shown, with the maximum value of ∼5.5 μg corresponding to a GNP concentration of 20 mg/cm3. The outline of the irradiated GNP-containing structures is overlaid on the fluorescence map, showing that there was a reasonable match between the images around the tumor region whereas there was a worsening of the spatial resolution for low concentration regions (the simulated blood vessels) primarily due to increased uncertainty in the fluorescence signal (i.e., insufficient data acquisition time).

