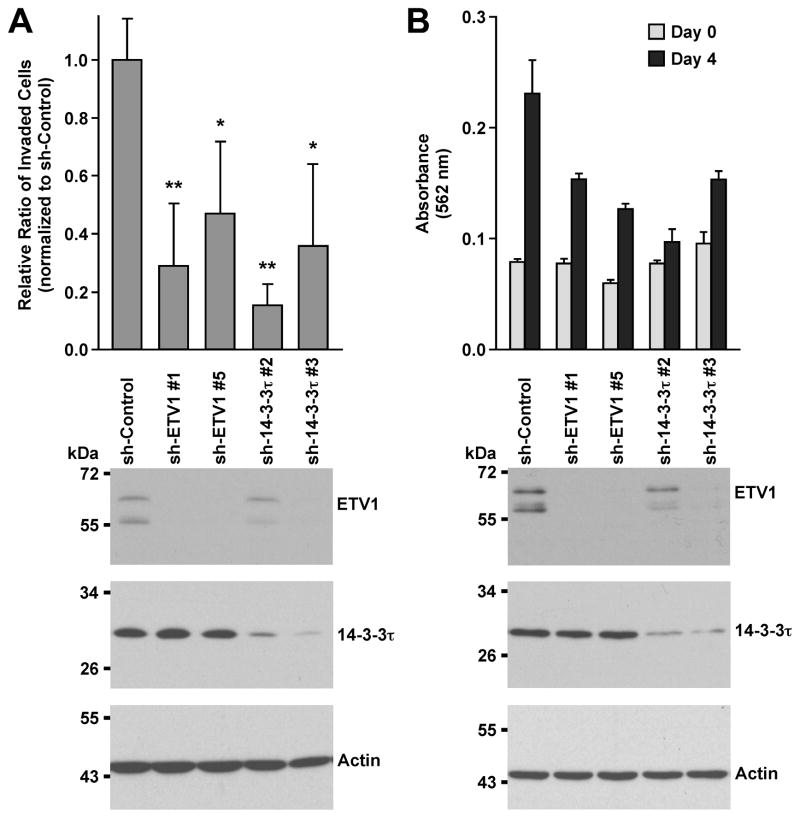
Figure 5.
Analysis of LNCaP cell physiology. (A) Cells were infected with retrovirus expressing indicated shRNA and selected in puromycin. Thereafter, cell invasion through collagen was measured. Bottom panels show Western blots for ETV1, 14-3-3τ and actin. *: p<0.05; **: p<0.01. (B) Cells were twice infected with retrovirus expressing ETV1 or 14-3-3τ shRNA and then seeded for growth assays two days later. Growth was significantly reduced (p<0.05) by all shRNAs employed compared to sh-Control.

