Figure 6.
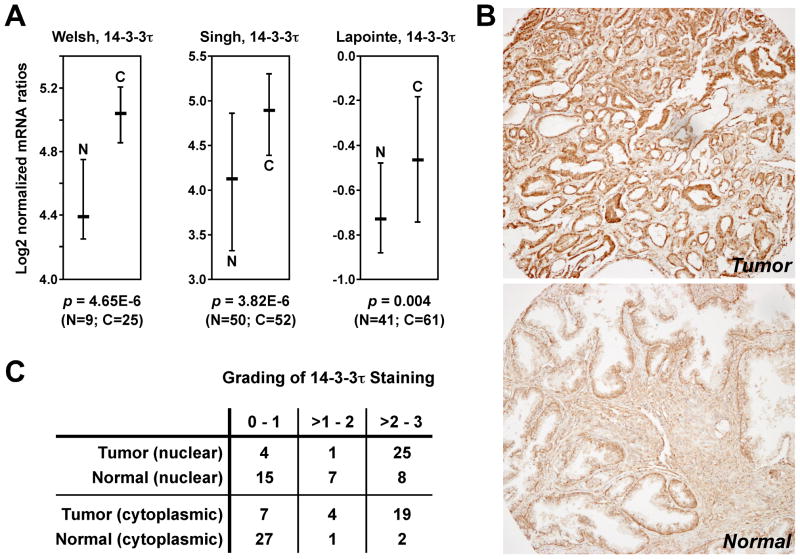
Overexpression of 14-3-3τ in prostate tumors. (A) Analysis of publicly available microarray data (23–25) through the Oncomine webtool. Shown are log2 median-centered ratios of 14-3-3τ mRNA levels with the median and 25–75 percentile range. N denotes normal prostate tissue, C prostate carcinoma. Statistical significance was determined with Student’s t-test. (B) Immunohistochemical analysis of 14-3-3τ expression in 30 pairs of human prostate tumors and matching normal tissues. Shown is a representative pair of tumor (top) and normal (bottom) tissue. Brown staining indicates the presence of 14-3-3τ, whereas blue color represents hematoxylin counter-staining. (C) Grading of 14-3-3τ protein expression in the cytoplasm and nucleus of 30 matching prostate tumors and normal tissues.

