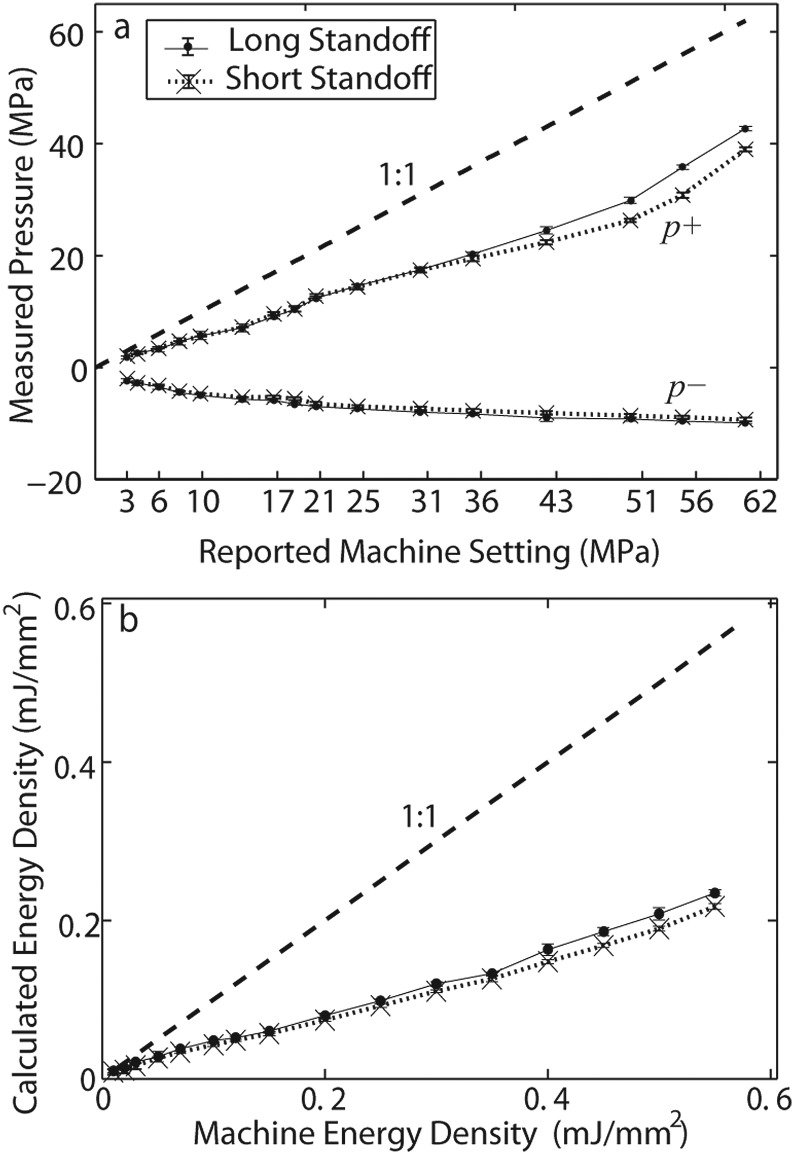
Figure 12.
(a) p+ and p− pressures measured at each machine output setting for both standoffs. (b) Calculated energy density (E.D.) at each machine setting for both standoffs. 1:1 line plotted for comparison on each plot. Measurements were collected at the measured focal point starting with the highest energy level and recording 25 waveforms independently for each energy level. Means and standard deviations (error bars) are shown.

