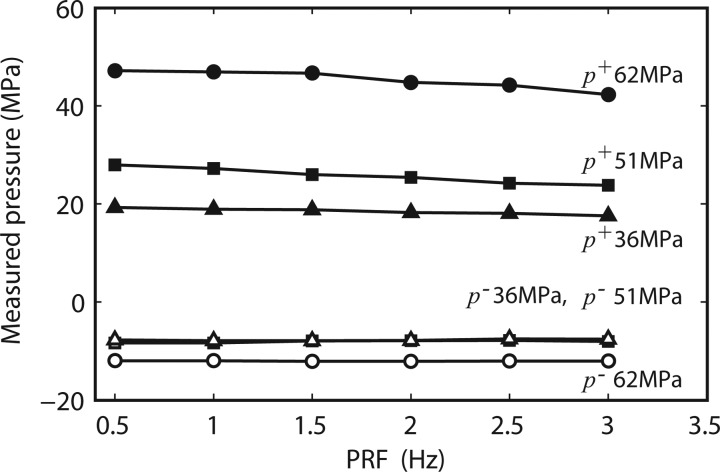
Figure 13.
Change in p+ (solid symbols) and p− (open symbols) pressure with respect to a change in machine PRF for three selected machine output settings: 62 MPa (no. 7), 51 MPa (no. 5), and 36 MPa (no. 4). The long 30 mm standoff was used for these measurements. Data acquired shows averaged pulses (50 pulses averaged) at a specific PRF. Means and STDs are less than 2% in all the cases.

