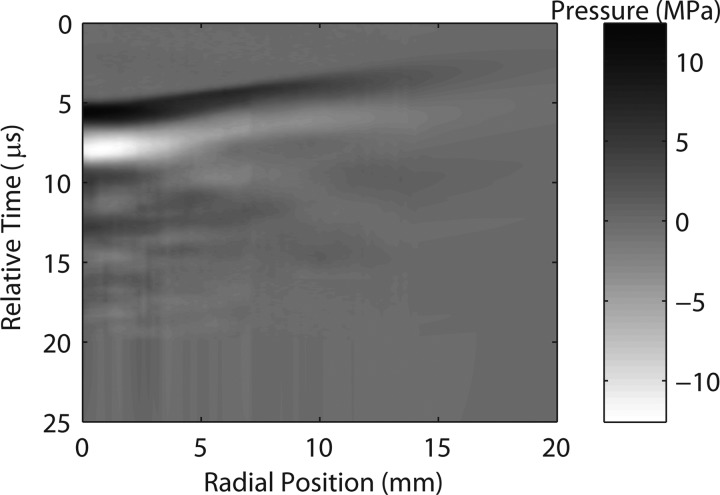
Figure 5.
Boundary condition map for the modeling algorithm. Experimental pressure waveforms were measured 5 mm from the short standoff along the radial (transverse) coordinate out to 14 mm. Numerically extrapolated waveforms extends the map out to 20 mm. In addition, 36 additional numerically interpolated waveforms were added between each two experimental waveforms, giving the map a total of 3701 waveforms. The low pressure tail described by Eq. 3 is not shown. Waveforms are represented by vertical lines; pressure is shown as in gray scale; the actual computational windows were 65.5 μs in time and 43.2 mm in the radial (transverse) direction. The time axis is relative to the time in Fig. 4 where the “0” corresponds to a time shift by 32 μs from the data in Fig. 4.

