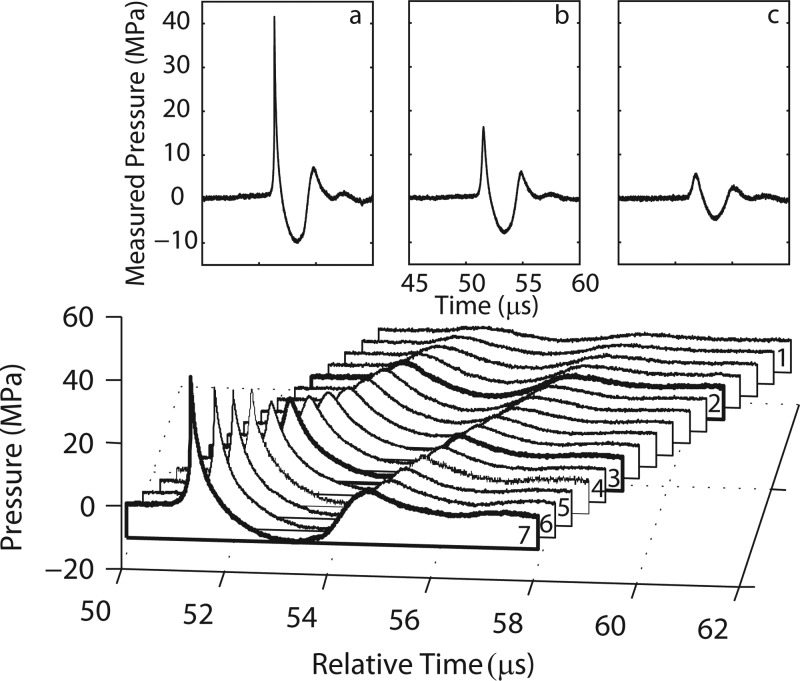
Figure 6.
Waterfall plot for all machine output settings from the long standoff. Individually labeled waveforms correspond to the machine setting shown in Table TABLE I.. Inset displays averaged waveforms for three different machine settings indicated as dark lines in the waterfall plot. (a) Setting no. 7 of 62 MPa nominal peak positive pressure; (b) setting no. 3 of 31 MPa; (c) setting no. 2 of 10 MPa.

