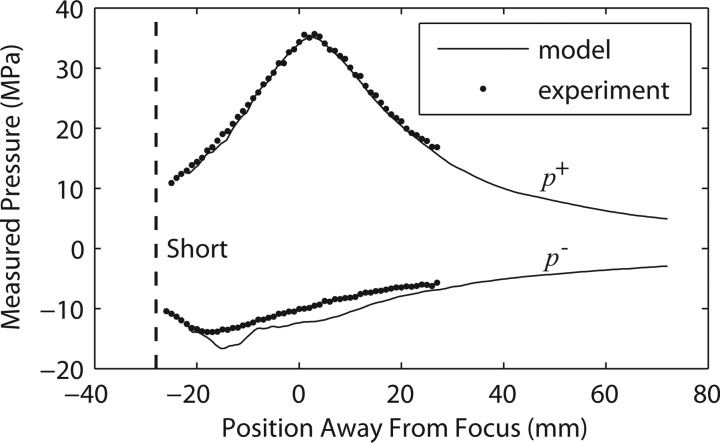
Figure 8.
Axial distribution of the averaged peak positive and peak negative pressures measured for the short standoff (black circles) and compared to the modeling results (solid lines) at the highest machine output setting (no. 7, 62 MPa). “Short” corresponds to the position of the therapy head edge of the short standoff.

