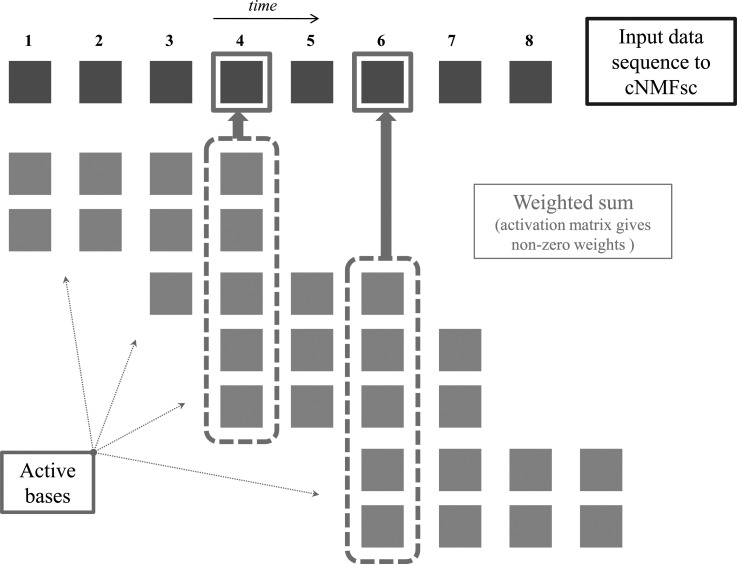
Figure 6.
(Color online) Schematic illustrating how shifted and scaled primitives can additively reconstruct the original input data sequence. Each gold square in the topmost row represents one column vector of the input data matrix, V, corresponding to a single sampling instant in time. Recall that our basis functions/primitives are time-varying. Hence, at any given time instant t, we plot only the basis functions/primitives that have non-zero activation (i.e., the corresponding rows of the activation matrix at time t has non-zero entries). Notice that any given basis function extends T = 4 samples long in time, represented by a sequence of four silver/gray squares each. Thus, in order to reconstruct say the fourth column of V, we need to consider the contributions of all basis functions that are “active” starting anywhere between time instant 1 to 4, as shown.

