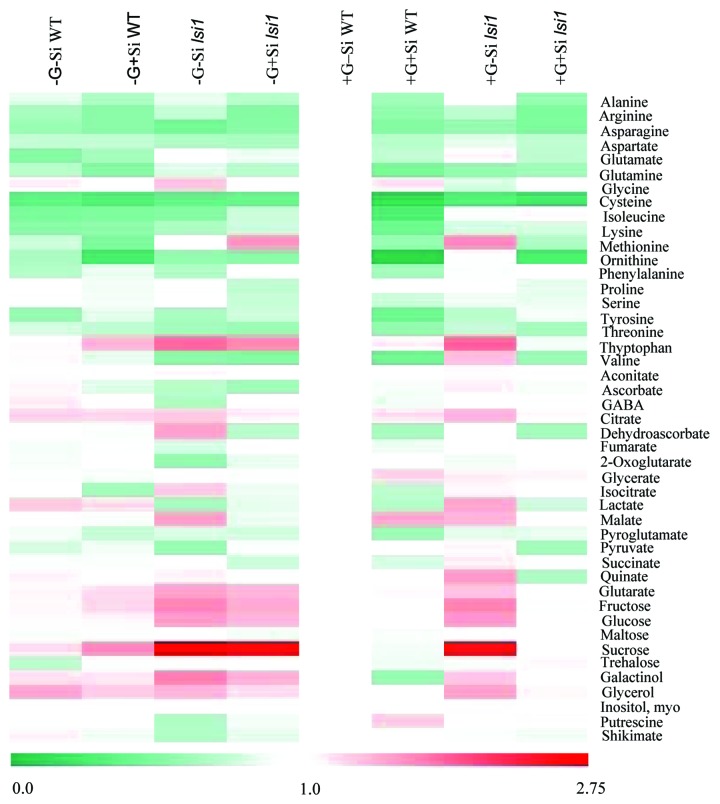
Figure 1. Changes in metabolite content in flag leaves of two rice genotypes [cv ‘Oochikara’ (WT) and the lsi1 mutant defective for Si uptake] under the effects of Si supply (0 and 2 mM: –Si and +Si, respectively) and grain load (0 or full grain burden: -G and +G, respectively). Overlay heat map of the metabolite profiles represents the changes in relative metabolite contents. The colors indicate the proportional content of each putatively identified metabolite among the samples, as determined by the average peak response area after normalization against the +G–Si WT plants. The lowest normalized value receives green, and the highest receives red (see color bar at the bottom).

An official website of the United States government
Here's how you know
Official websites use .gov
A
.gov website belongs to an official
government organization in the United States.
Secure .gov websites use HTTPS
A lock (
) or https:// means you've safely
connected to the .gov website. Share sensitive
information only on official, secure websites.
