Figure 4.
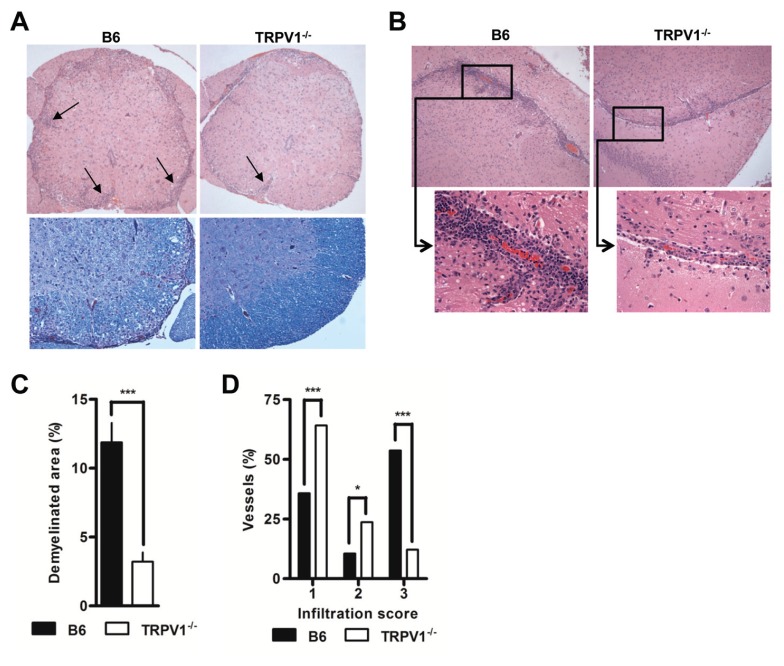
TRPV1 expression correlates to infiltration and demyelination. (A) Representative spinal cord sections stained with H&E (upper) and LFB (lower), original magnification 20×. (B) Representative brain sections stained with H&E, original magnification 20×, and 40× for smaller insets. (C) Quantification of demyelinated areas of spinal cord tissue from B6 and TRPV1−/− mice 16–18 d after immunization (n = 5 per group, p < 0.0001). (D) Blinded quantification of cellular infiltration in B6, TRPV1+/−, and TRPV1−/− mice euthanizes 16–18 d after immunization (n ≥ 95 per group, *p < 0.05, **p < 0.01, ***p < 0.001).

