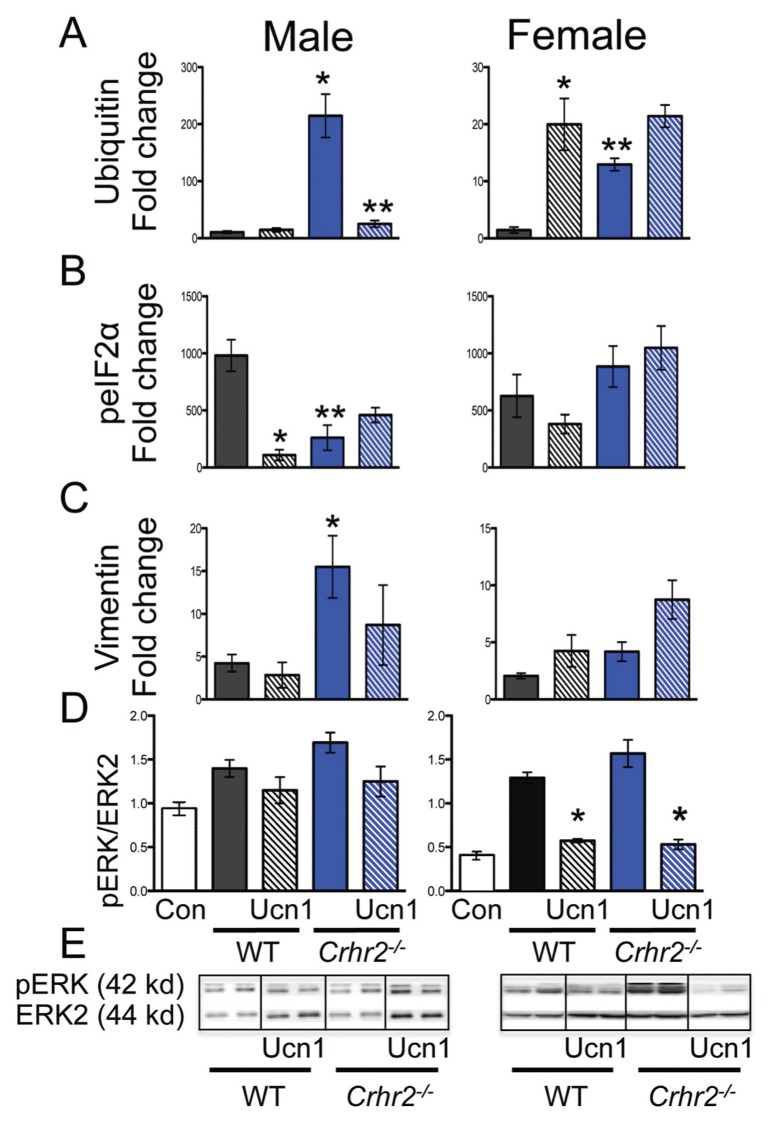
Figure 7.
ER stress response is restored after Ucn1 treatment. Graphical representation of fold-change in staining intensity for ubiquitin (A), peIF2α (B), and vimentin (C) over saline-treated controls is shown (*p < 0.05, WT versus Crhr2−/−). Simultaneous Ucn1 treatment decreased ubiquitin levels in male Crhr2−/− mice (** p < 0.05) and peIF2α levels in male WT mice (*p < 0.05) (A, B). Western blot analysis of pancreatic lysates was performed (D, E), and representative Western blot from two mice per group is shown (E). Quantitation of pERK1/2 normalized to total ERK showed significant increases in pERK1/2 in male and female WT and Crhr2−/− mice (D, *p < 0.05). Ucn1 treatment did not affect pERK levels in male WT or Crhr2−/− mice, but significantly (**p < 0.05) reduced pERK levels in female WT and Crhr2−/− mice. Statistical analyses were performed between same-sex groups by using ANOVA. Data represent mean ± SEM of 12 mice per group.

