Figure 5.
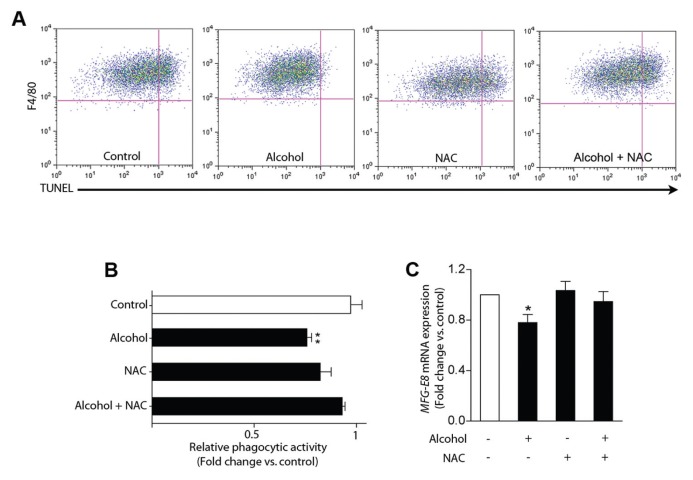
ROS mediates alcohol effect on impairment of macrophage efferocytosis and MFG-E8 gene expression. Peritoneal macrophages were subjected to treatment with culture medium alone (control), alcohol (25 mmol/L), NAC (10 mmol/L) or alcohol (25 mmol/L) + NAC (10 mmol/L) for 18 h as indicated in the figure. After treatments, part of samples in each treatment group was cocultured with apoptotic cells in the 1:4 ratio for 90 min, stained and followed by analysis of macrophages with engulfed apoptotic cells using the flow cytometry as described in the Figure 2 legend. The remaining samples were processed for RNA isolation followed by determining mRNA transcripts of MFG-E8 gene with a quantitative real-time RT-PCR method as described in the Figure 1 legend. (A) Representative scatter plots of FACS analysis for determining macrophages that engulfed apoptotic cells in each treatment group. (B) Results of quantitatively analyzing efferocytotic ability of macrophages in each treatment group with FACS. (C) Results of quantitatively analyzing MFG-E8 mRNA in macrophages with real-time RT-PCR. In panels B and C, values are mean ± SEM and represent average of findings from two independent experiments with triplicate samples in each group. *P < 0.05 versus the control group, **P < 0.01 versus the control group.

