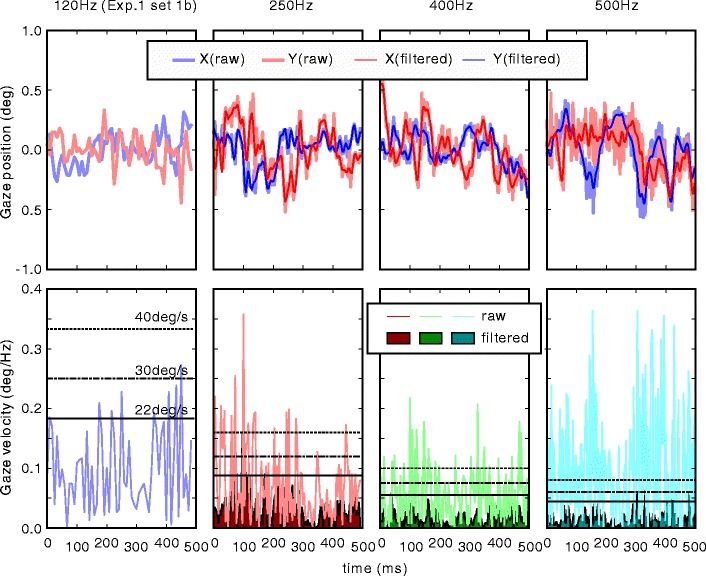
Fig. 6.

Effect of measurement noise on detecting saccades. Columns correspond to 120-, 250-, 400-, and 500-Hz measurements from left to right. Top row: Raw data and low-pass filtered data (only raw data are plotted for the 120-Hz measurement). Bottom row: Absolute velocity of raw data and filtered data. Note that the unit is not °/s but °/Hz. Horizontal black lines indicate 40, 30, and 22 °/s from top to bottom
