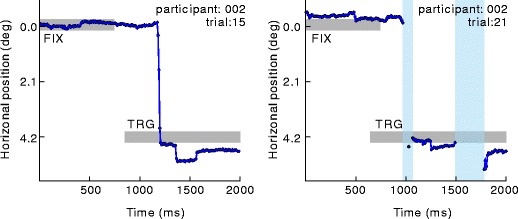
Fig. 7.

Examples of recorded data. Left and right panels show data from the same participant. Blue lines indicate gaze position, and gray bars indicate presence of the initial fixation point and the target. Pale blue areas indicate that eye position detection failed during this period. In the left panel, eye position detection failure occurred near the saccade onset; therefore, that detection of saccade onset failed. Such a failure occurred in 2 participants more often, when compared with the other participants
