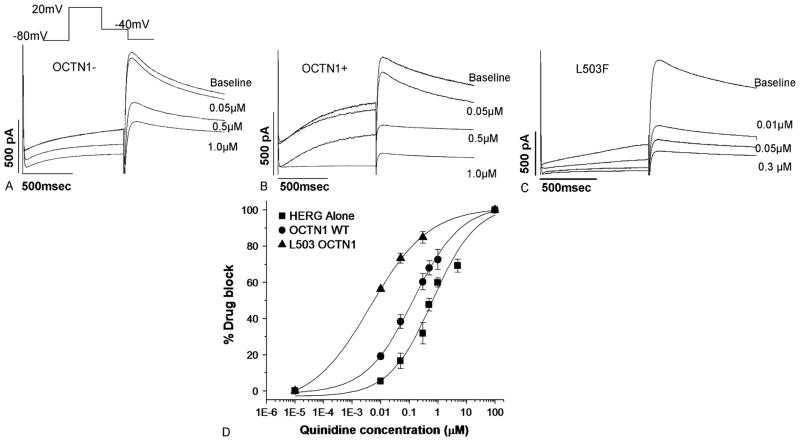
FIGURE 4.
Functional effects of coexpressing OCTN1 with HERG. (A) Response of IKr in an OCTN1– cell exposed to serially increasing quinidine concentrations. (B) Response of IKr in an OCTN1+ cell exposed to serially increasing quinidine concentrations. (C) Response of IKr in an L503F OCTN1+ cell exposed to serially increasing quinidine concentrations. (D) Dose–response curves.

