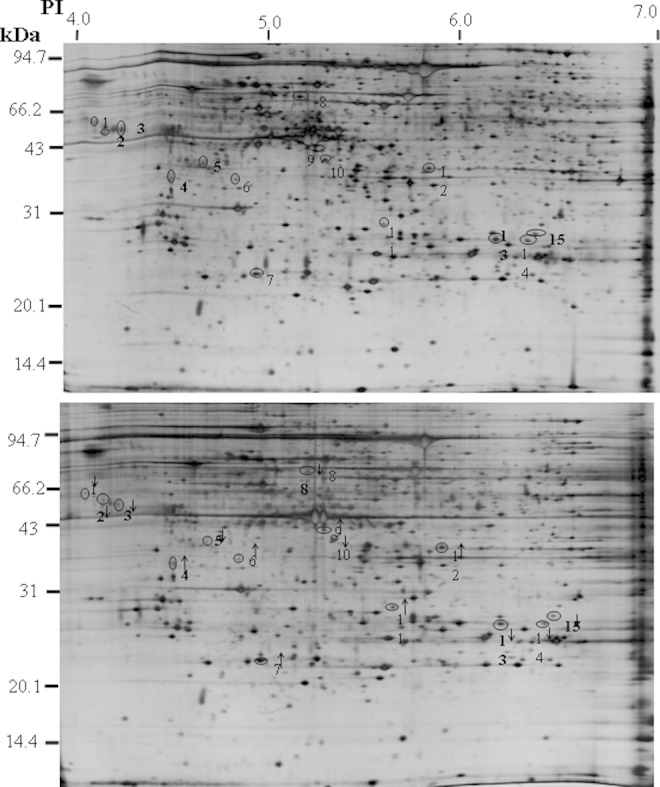
Figure 1.

Representative 2-dimensional electrophoresis (2-DE) protein maps of radiofrequency electromagnetic field (RF-EMF)-exposed group and control groups. Two representative 2-DE maps indicating protein spots that changed in volume in placental villous samples from the control (A) and RF-EMF-exposed group (B). The 15 proteins found to be significantly (P < .05) decreased or increased in placental villous tissues from the RF-EMF-exposed group compared to the control, which are marked with numbers and downward or upward arrows.
