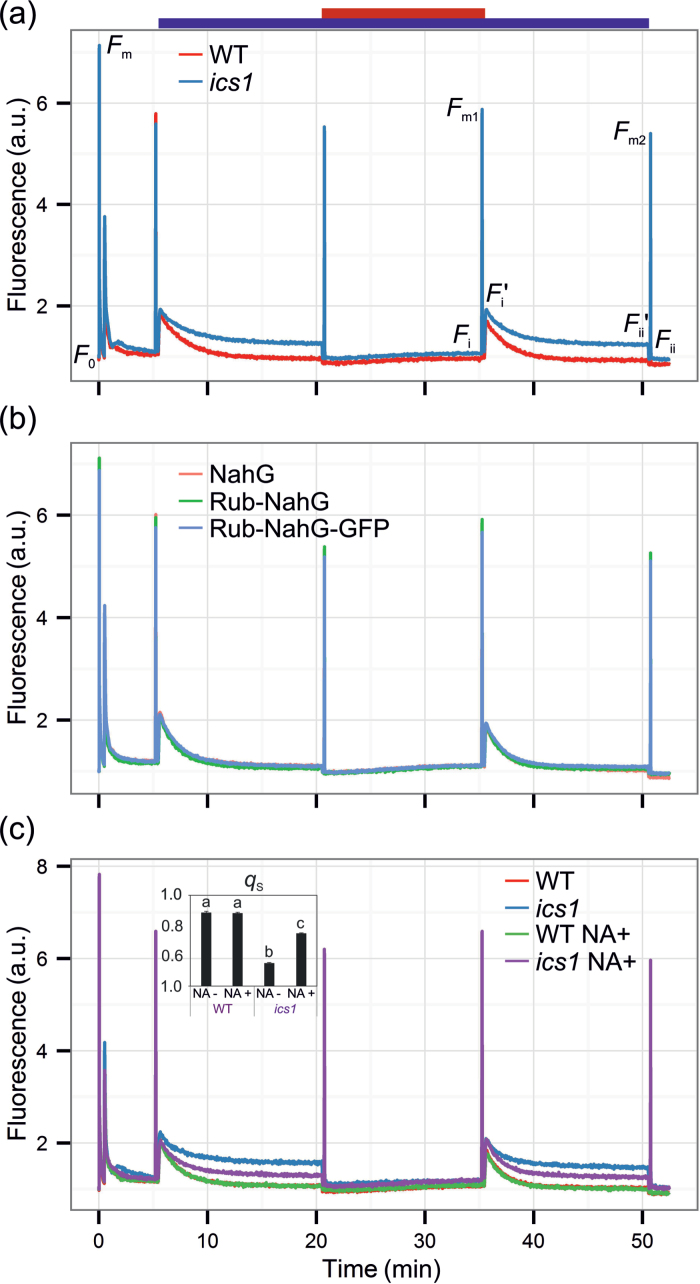
Fig. 1.
State transition in wild-type and ics1 plants (a), NahG transgenic plants with both a cytosolic- and chloroplast-targeted SA-degrading enzyme (b), and wild-type and ics1 plants supplemented with the phylloquinone precursor (1,4-dihydroxy-2-naphthoic acid; NA) (c). The top bar depicts lights applied during a particular period of the measurement; blue, actinic light on; red, far-red light on. The graph shows representative measurements of six whole rosettes for each genotype and treatment. The inset in (c) shows the q S parameter (mean ±SD) for the analysed genotypes and treatments. Homogeneous groups were calculated using Tukey HSD analysis. For details, see the Materials and methods.

