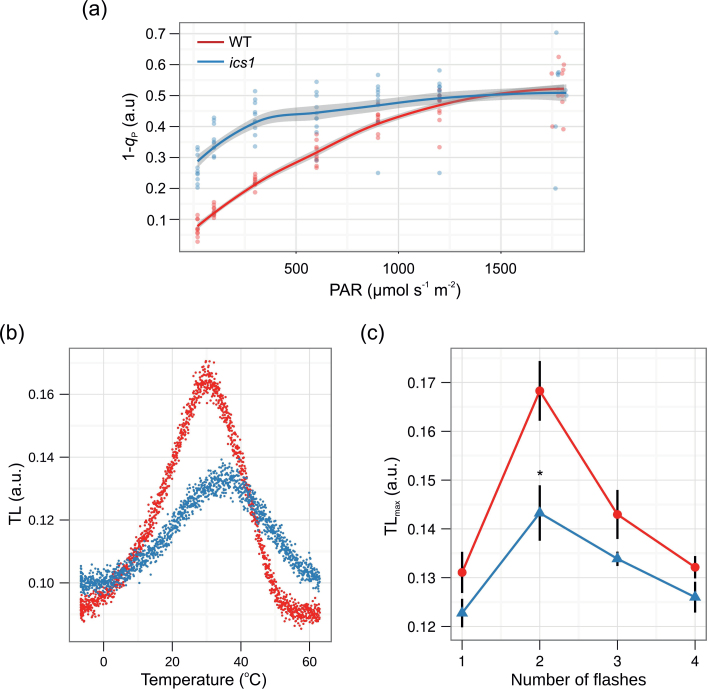
Fig. 3.
Redox status of the plastoquinone pool. (a) Light curve of the redox status of the PQ pool (1–q P). Data represent an average from 10 different rosettes (n=10, grey shading indicates the 95% confidence intervals for the analysed genotypes). (b and c) Thermoluminescence (TL) measurements. (b) TL glow curves in wild-type (WT, red dots) and ics1 (blue dots) plants. The figure shows representative measurement of the leaves excited with two flashes. (c) Flash-induced oscillation of the B-band amplitude (TLmax) in wild-type (WT, red line and dots) and ics1 (blue line and triangles) plants. Values are means ±SEM of seven independent measurements (leaves from seven independent plants). Asterisks indicate a significant difference from the control at P < 0.05 (according to Student’s t-test).

