Fig. 5.
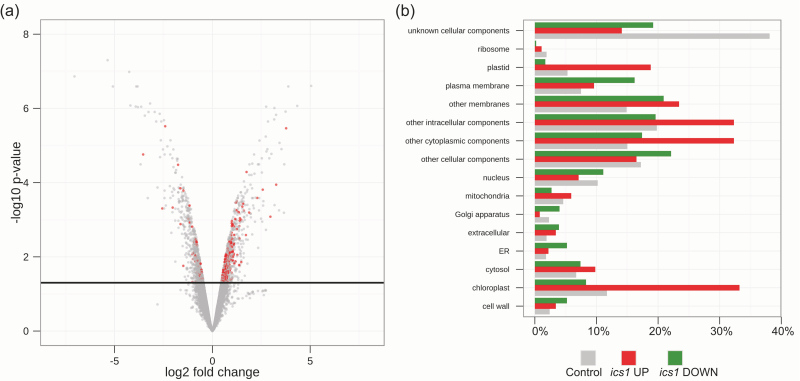
Microarray analysis of the ics1 mutant. (a) Volcano plot of microarray data. The log fold change is plotted on the x-axis (down-regulated genes on the left side, up-regulated on the right) and the negative log10 P-value is plotted on the y-axis. The black, solid line represents the P-value cut-off (0.05, Student’s t-test). Points above the line have P-values <0.05 and points below the line have P-values >0.05. The red points represent genes whose protein products are targeted to the chloroplasts. (b) Gene ontology (Cellular Component) of genes induced (red) and suppressed (green) in ics1. As a control, whole-genome categorization (grey) was used.

