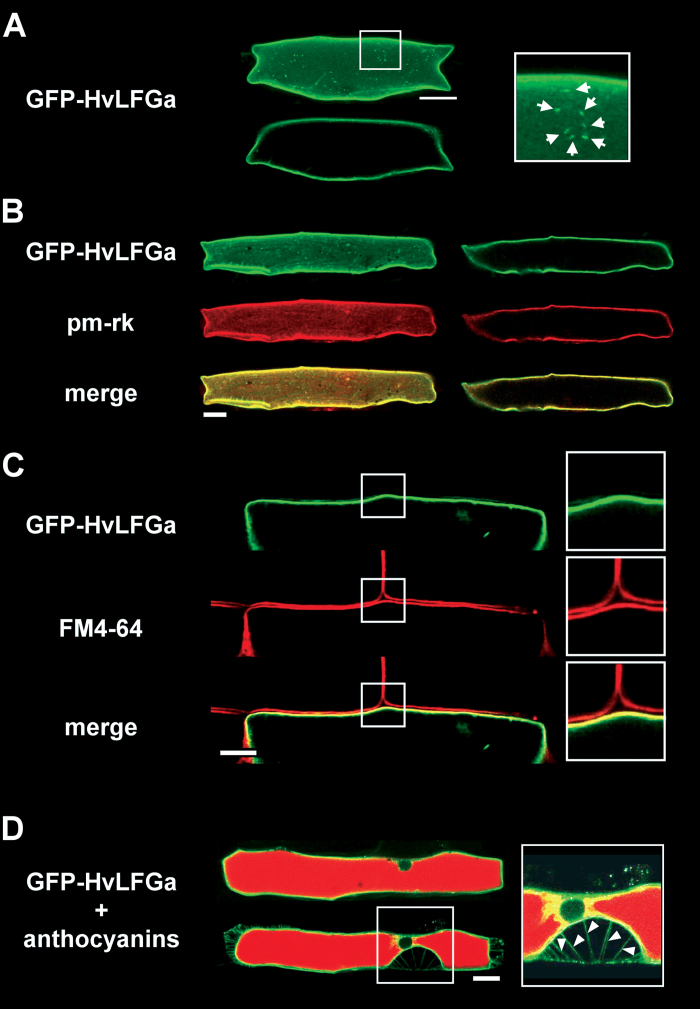
Fig. 3.
Localization of a GFP-HvLFGa fusion protein in barley epidermal cells after transient transformation as visualized by confocal laser-scanning microscopy. (A) The upper picture is a whole-cell projection of a transformed cell; the lower picture shows a single longitudinal section (top view) through the centre of the same cell. The framed picture in the right panel represents an enlargement of the marked area in the whole-cell projection. (B) Co-expression of GFP-HvLFGa with the red fluorescent plasma membrane marker pm-rk; left panel: whole-cell projection; right panel: single longitudinal section (top view) through the centre of the same cell; yellow pixels in the merged images indicate co-localization. (C) Longitudinal cross-section of a part of a single GFP-HvLFGa-expressing cell after staining with FM4-64 for 15 minutes; framed images on the right are enlargements of the framed areas in the left panel; yellow pixels in the merged images indicate co-localization. (D) GFP-HvLFGa-expressing cell that accumulates red fluorescent anthocyanins in the vacuole after co-expression of maize B-Peru and C1 genes; single longitudinal section of the cell before (top) and after (bottom) plasmolysis; arrowheads in the magnified detail on the right point to Hechtian strands. Bars = 25 μm.

