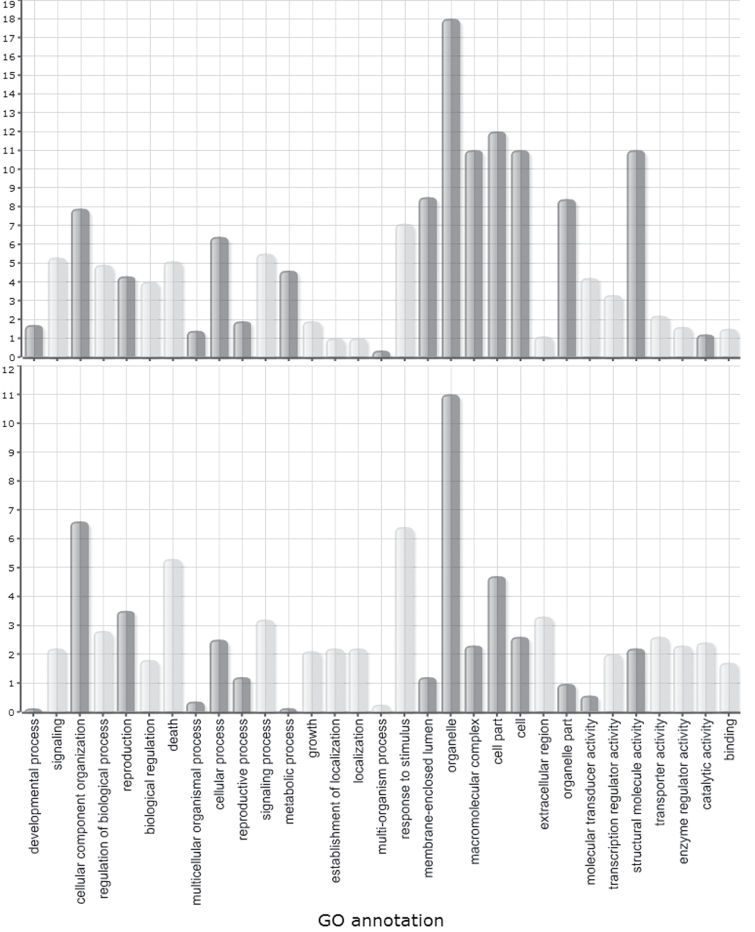
Fig. 2.
Parametric Analysis of Gene Set Enrichment (PAGE) of transcriptome data from giant cells induced by RKN in rice at 7 dai (top) and 14 dai (bottom). Z scores of all secondary-level GO terms are shown. Bars in dark grey indicate GO terms that are upregulated in the infected tissue versus the corresponding control; light grey bars indicate GO terms that are downregulated in the infected tissue versus the corresponding control.

