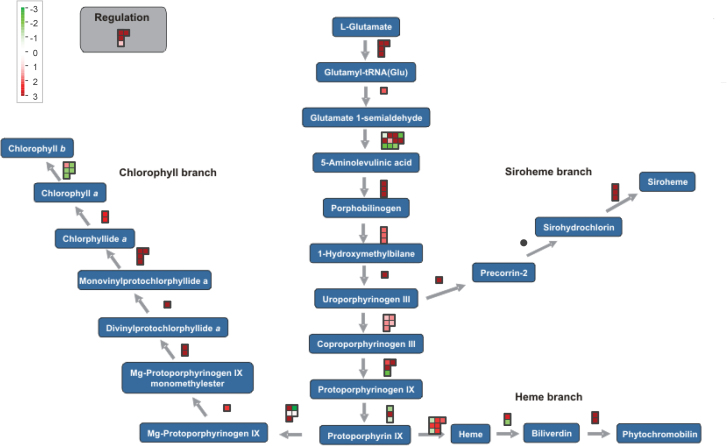
Fig. 3.
MapMan visualization of the expression profiles of genes involved in tetrapyrrole biosynthesis in 7 dai giant cells. The visualization shows the observed differential expression patterns, based on the log2FCs of mRNA levels, in giant cells versus control cells. Dots show the different paralogous genes encoding the enzyme that catalyses a certain step. Red dots indicate that the gene is upregulated in infected tissue versus the corresponding healthy control, while green indicates downregulation.

