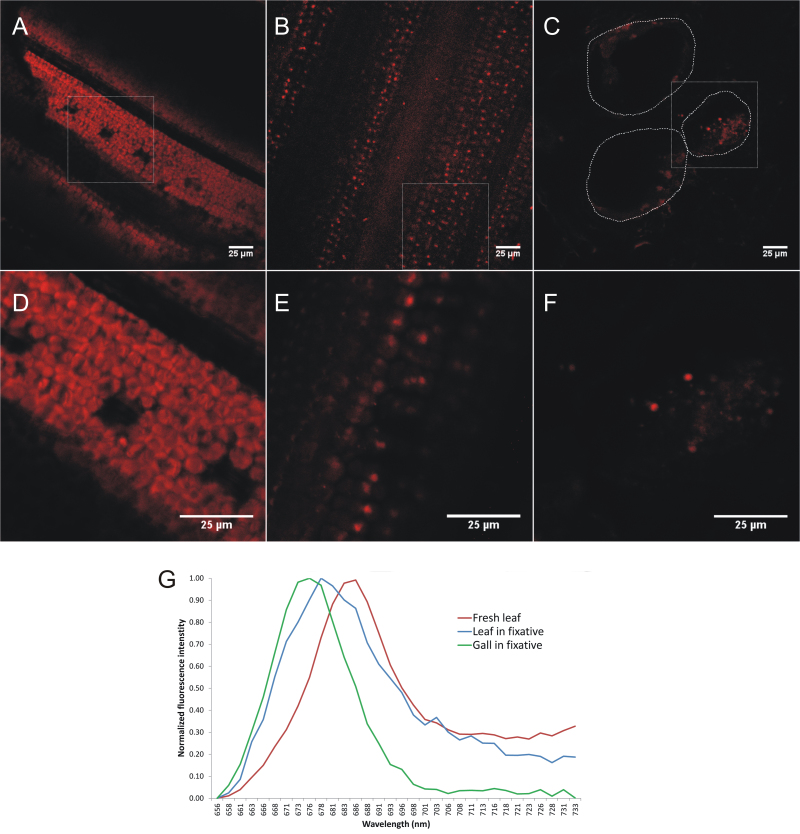
Fig. 4.
Confocal microscopy and spectral profiling of chloroplast (-like) autofluorescence. (A–F) Confocal images were acquired from sections of fresh leaves (A, D), fixed leaves (B, E), and fixed giant cells (C, F) at two different zoom factors – 1× (A, B, C) and 3× (D, E, F) – using a spectral detector set to capture chlorophyll a autofluorescence (655.5–735.5nm). White squares in A, B, and C, show the region that was magnified in D, E, and F, respectively. The dotted lines in C delineate the boundaries of the giant cells. Note the difference in shape between chloroplasts of fresh and fixed leaf sections and the presence of chloroplast-like structures in the giant cell section. (G) Average spectral profiles, measured as average intensity per wavelength interval across the lambda stack range for at least four (presumed) chloroplast regions.

