
Figure 1.
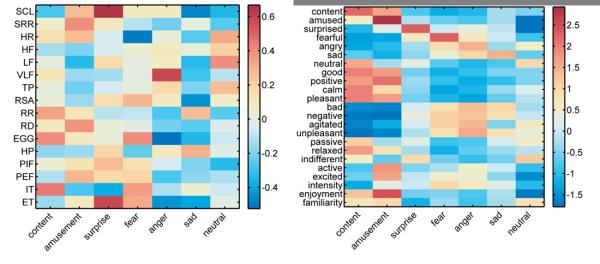
Inputs for pattern classifiers averaged across subjects from peripheral physiology (left) and self-report (right). Colorbars indicate average z-scores standardized within subjects. SCL = tonic skin conductance level; SRR = number of phasic skin conductance responses; HR = heart rate; HF = high frequency cardiac power; LF = low frequency cardiac power; VLF = very low frequency cardiac power; TP = total cardiac power; RSA = respiratory sinus arrhythmia; RR = respiration rate; RD = respiratory depth; EGG = three cycle per minute gastric activity; HP = heart period; PIF = peak inspiratory flow; PEF = peak expiratory flow; IT inhale time; ET = exhale time.