
Figure 3.
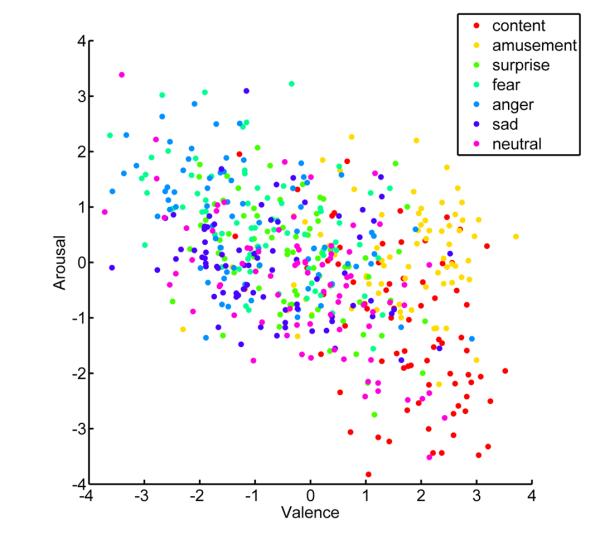
Dimensional sampling from self-report of emotion. Scatterplot shows the distribution of experienced emotion along dimensions of arousal and valence for all 560 trials. The location for trials along the valence axis reflects the average response of self-report items “good,” “positive,” and “pleasant” minus the scores for items “bad,” “negative,” and “unpleasant.” The location along the arousal axis is indicative of the mean value of items “agitated,” “active,” and “excited,” while subtracting the average value of responses for “calm,” “passive,” and “relaxed.”