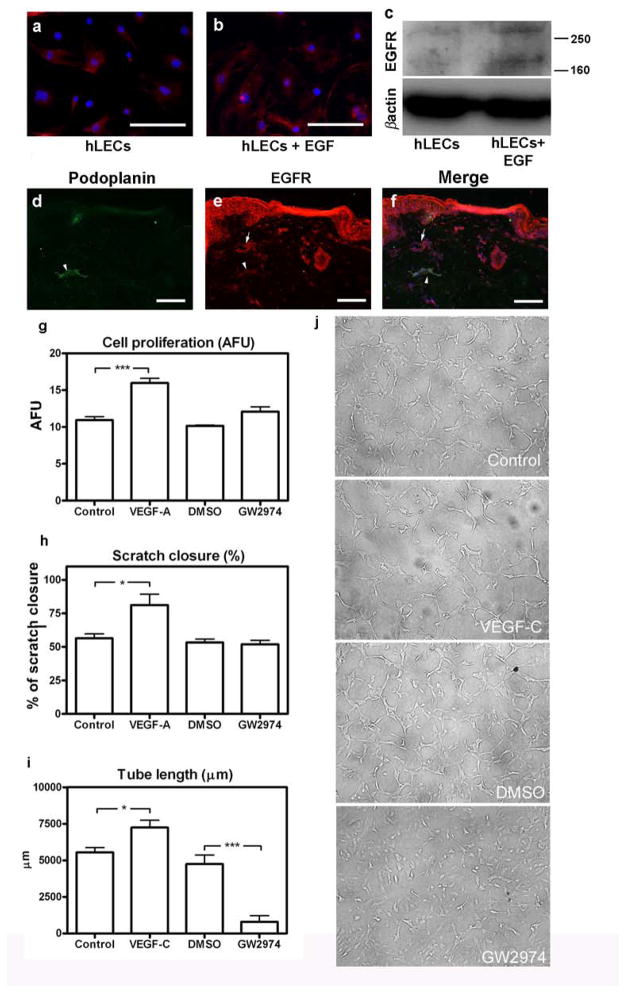
Fig. 3. EGFR is expressed by human lymphatic endothelial cells and is involved in tube formation in vitro.
EGFR expression by cultured human LECs was assessed by immunofluorescence (a, b; red) and Western blot (c). EGFR appeared as two bands (ca. 170 and above 250 kDa), possibly representing the monomeric and dimeric receptor [40]. Lymphatic vessels in human skin expressing EGFR (red) and podoplanin (green) are indicated by arrow heads (d, e, f); blood vessels expressing only EGFR are indicated by arrows (e, f). Scale bars: 50 μm. Proliferation (g), migration/scratch closure (h) and tube formation (i, j) by human dermal LECs were assessed after GW2974 (10 μM) treatment. VEGF-A and -C served as positive controls, medium alone as negative control. Data are expressed as mean values (n=3) + SEM; *p<0.05; **p<0.01; *** p<0.001. AFU: absolute fluorescence units. Scale bars: 50 μm.

