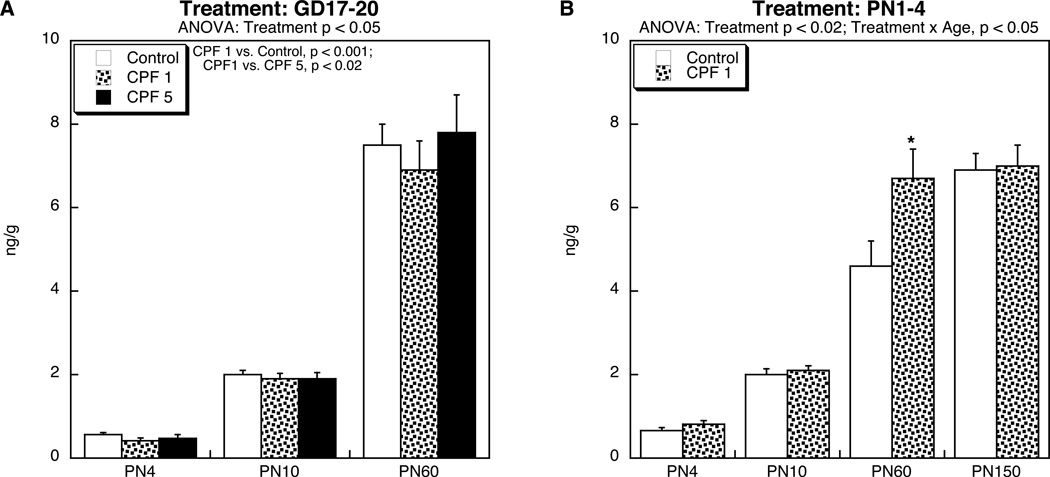
Figure 1.
Effects of CPF exposure (A) during gestation (GD17-20), or (B) postnatally (PN1-4) on T4 levels in the brain. Data represent means and standard errors obtained from 8–12 animals in each treatment group at each age. In (A), we used brainstem samples at all ages, whereas in (B) we used whole brain on PN4, brainstem on PN10 and cerebellum on PN60 and PN150. Results of multivariate ANOVA are shown at the top of each panel. Values for males and females were combined because of the absence of either a main effect of sex or a treatment × sex interaction. In (A), there was a main treatment effect without a treatment × age interaction, so post-hoc analysis was limited to main effects only, showing a significant reduction caused by CPF 1 mg/kg as compared to either the controls or the CPF 5 mg/kg group. In (B), there was a main treatment effect (CPF 1 > Control) but also a treatment × age interaction; the asterisk denotes the individual age at which CPF evoked a significant increase.

