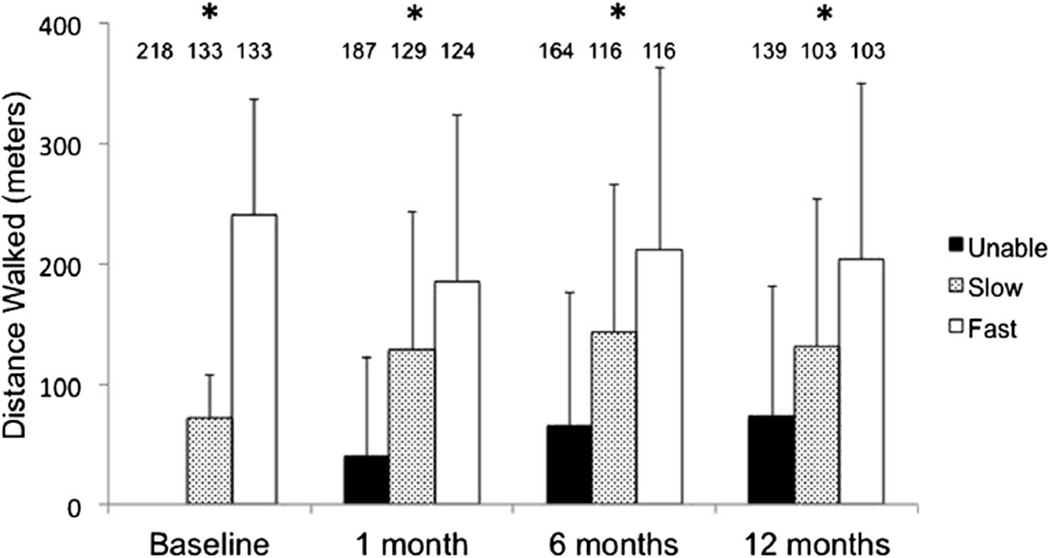
Figure 2.
Six-minute walk test distance at baseline, 1 month, 6 months, and 1 year after TAVI. Asterisk (*) indicates overall comparison significant at a level of p <0.001 (analysis of variance) and all pairwise comparisons significant at a level of p <0.05 (Tukey corrected t tests). The number of participants at each time point is indicated over each bar.

