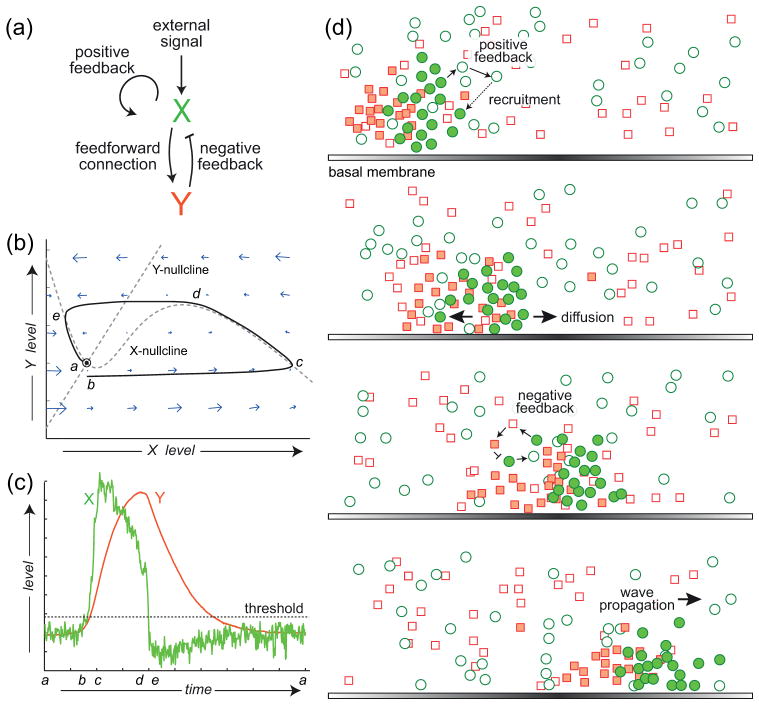
Figure 2. Dynamical description of excitable behaviour.
(a) Schematic of an activator (X)-inhibitor (Y) system, a common framework for studying excitable systems. The system has an autocatalytic positive feedback loop and a negative feedback loop through the inhibitor. (b) Phase-plane description of the dynamics of the excitable system. The intersection of the two nullclines (lines for which the level of one component remains constant) denotes the equilibrium, which is dynamically stable. In the absence of perturbations, the system remains there (labelled “a”). A sufficiently large disturbance leads to a large trajectory is phase-space (b to c to d to e) before returning to the equilibrium. (c) Trajectories of the activator (green) and inhibitor (red) as a function of time. Note the sub-basal excursion in the level of the activator, (d to e) which marks the refractory period of the excitable system. (d) Cartoon illustrating how an excitable activator-inhibitor system can give rise to propagating waves. The positive feedback loop means that functional (shaded green circles) activator molecules recruit other activator molecules (open green circles), thus propagating. They also activate inhibitor molecules (shaded red squares) which turn off the activity. (Reprinted with permission from Ref. 3. Copyright 2012 Elsevier Inc.)

